


Pricing page and pricing table examples

474 real pricing sections from 285 captured websites

Compare plan cards, pricing tables and usage breakdowns. Below the gallery: six reviewed patterns, two pricing-page first views, a checklist and an original billing demo.

Need the wider page context? Browse full pricing-page references.

Filter

Colour family

Exact colour

Matched by perceptual (OKLab) distance to each palette and the colours measured in the capture.

Background

Six reviewed pricing table examples

Use these pricing page design references to compare billing units, seat types, usage allowances, estimates, fee breakdowns and feature matrices. They are visual evidence, not verified current prices or conversion benchmarks.

Notes reviewed . Screenshots and brand assets belong to their respective owners. Collection dates below are not individual inner-page capture timestamps.

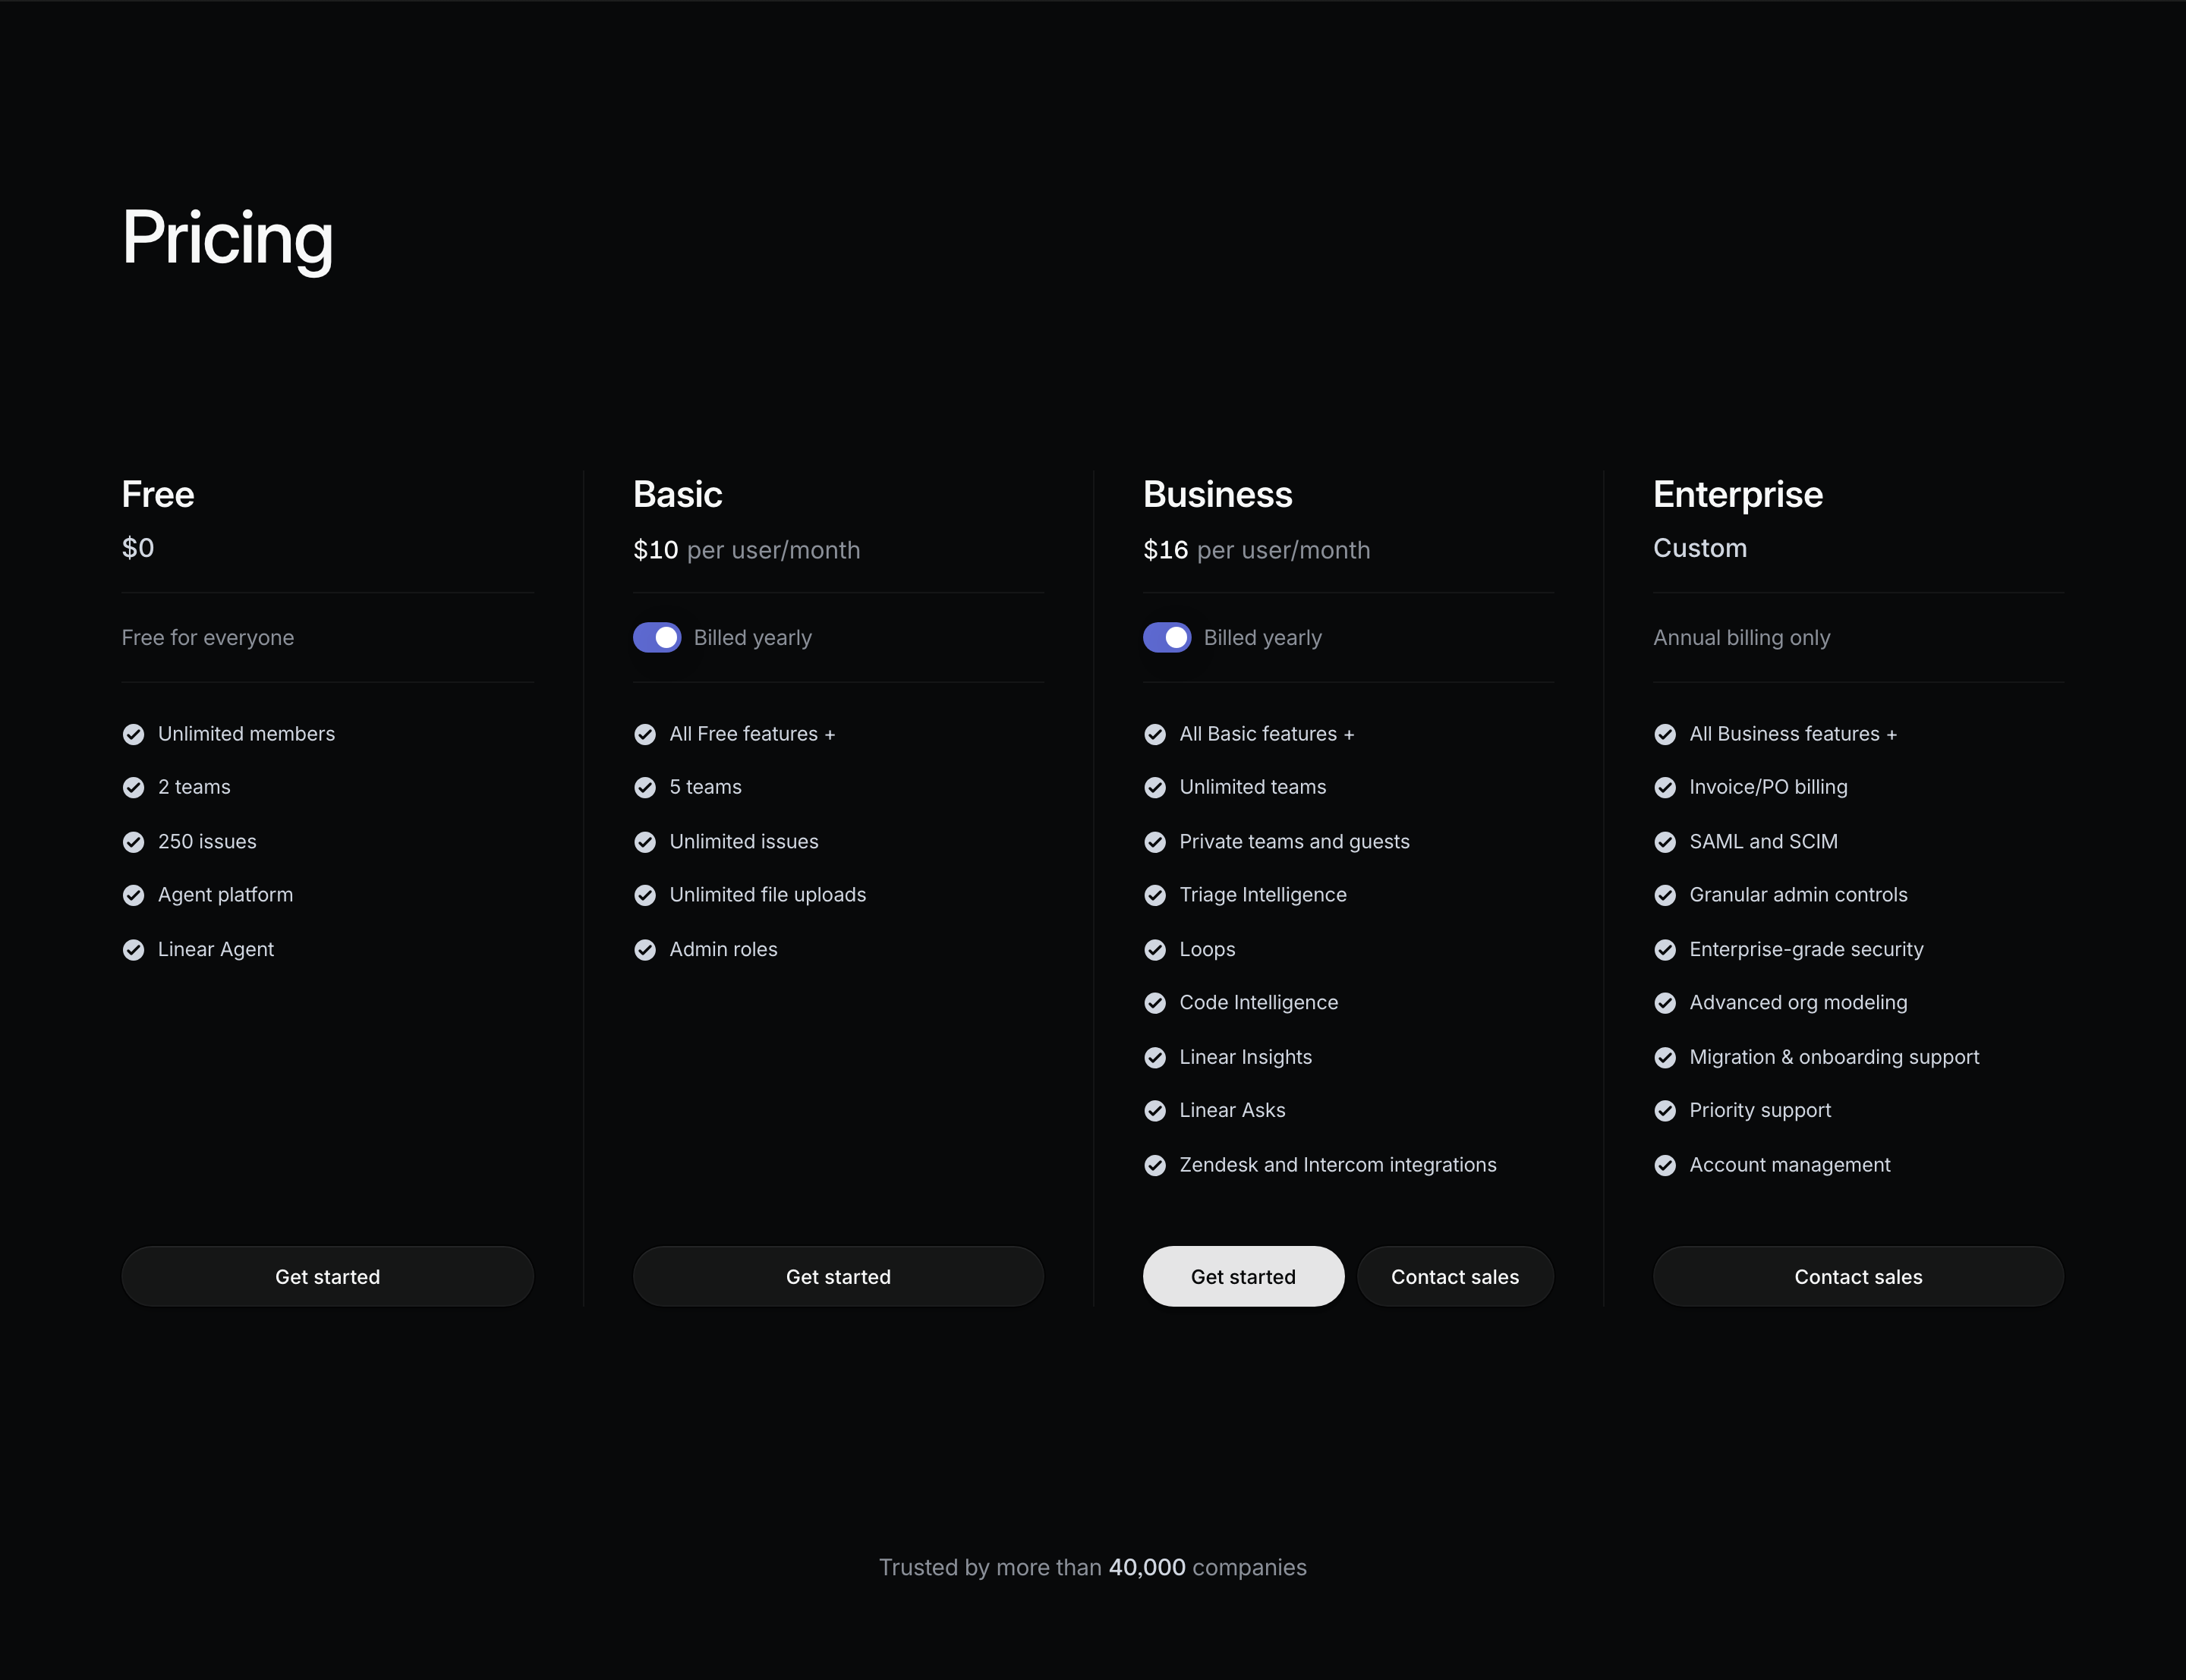
Linear pricing section with Free, Basic, Business and Enterprise columns, yearly billing switches and distinct start or sales actions
Collection date · · Linear source collection

Linear

Keep the billing unit beside each plan price

What the capture shows
Four plan columns put the amount and per-user/month unit above feature lists. The paid self-serve columns show yearly billing switches, while Enterprise says custom with annual billing only. Business offers both a start and sales route.
What to adapt and test
Separate the displayed monthly equivalent from the actual charge schedule. Give each tier a clear audience and action; make any difference between self-serve and sales understandable.
Limits of the reference
Only the captured billing state is observed. No switch interaction, current price, annual invoice total or conversion result is verified.
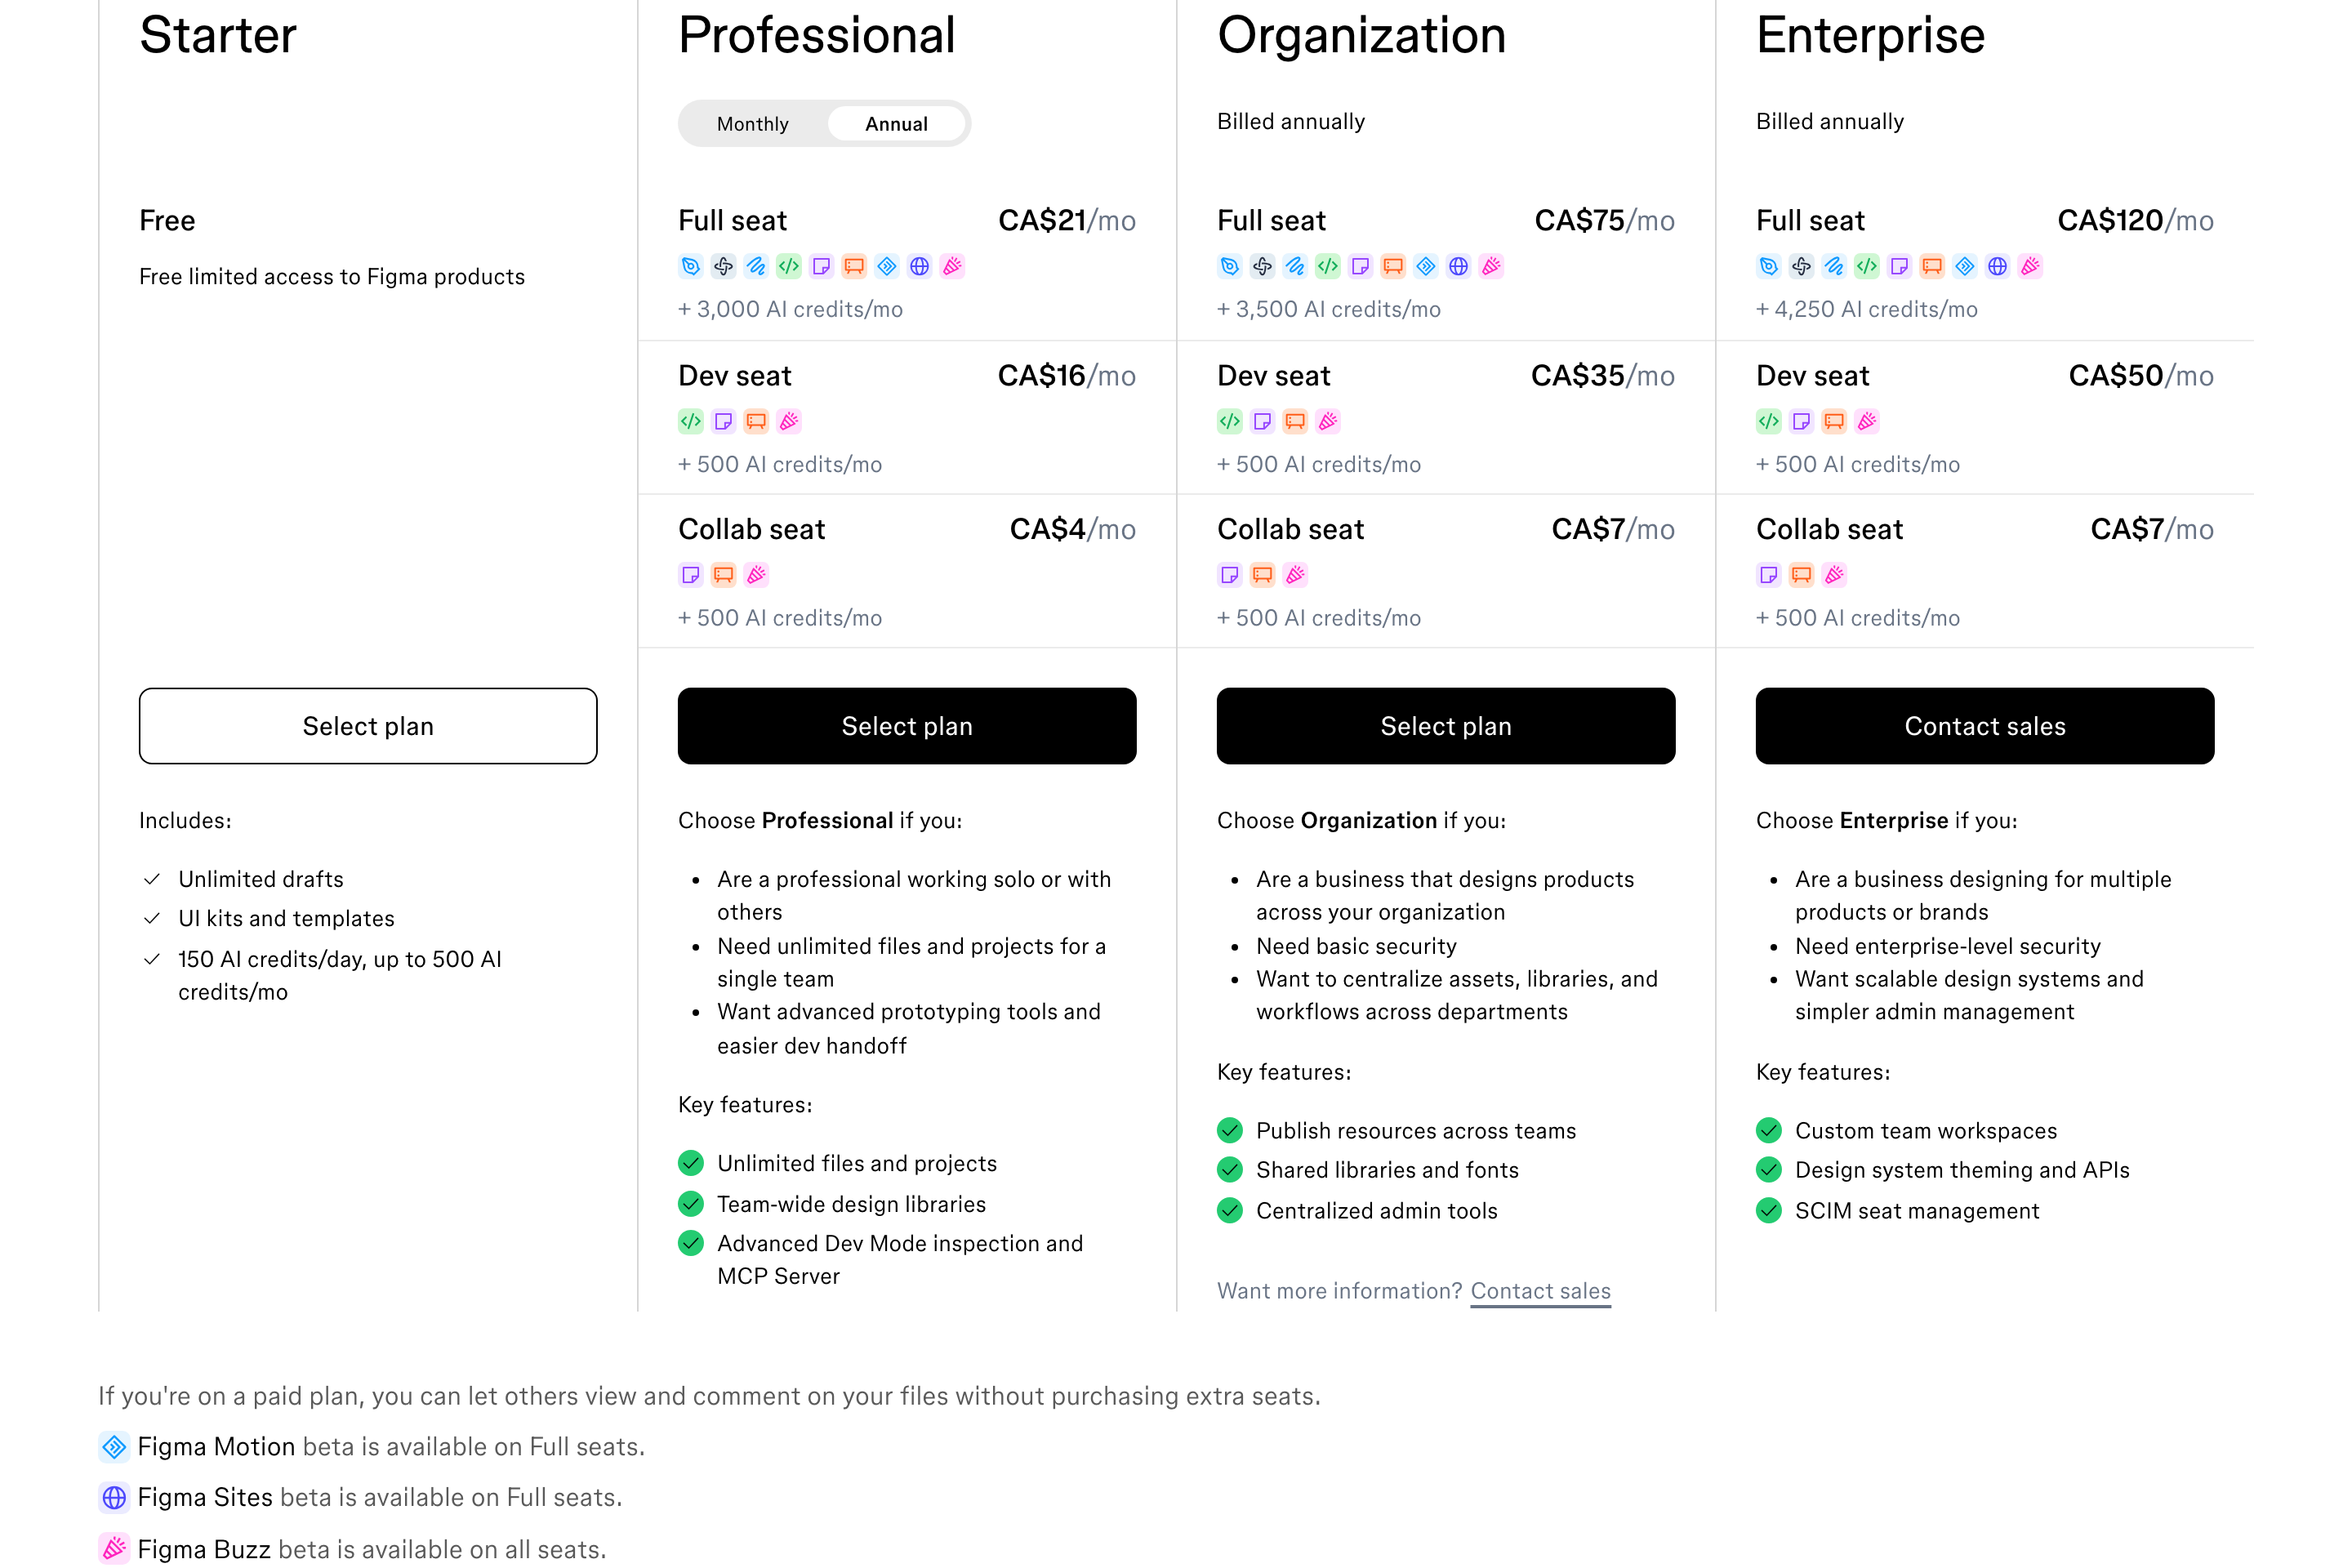
Figma pricing section comparing Starter, Professional, Organization and Enterprise with multiple seat types and Canadian-dollar prices
Collection date · · Figma source collection

Figma

Explain seat types within each tier

What the capture shows
Paid columns separate Full, Dev and Collab seats instead of presenting one price for every user. Professional shows a Monthly/Annual control with Annual selected; the larger tiers carry annual billing labels. Prices use a CA$ prefix.
What to adapt and test
When access varies by role, define the seat types and their units before asking someone to choose. Keep the currency, billing state and included allowances visible together.
Limits of the reference
The captured Canadian-dollar display is not a US price quote or a current offer. Product access, credits and the alternate billing state were not tested.
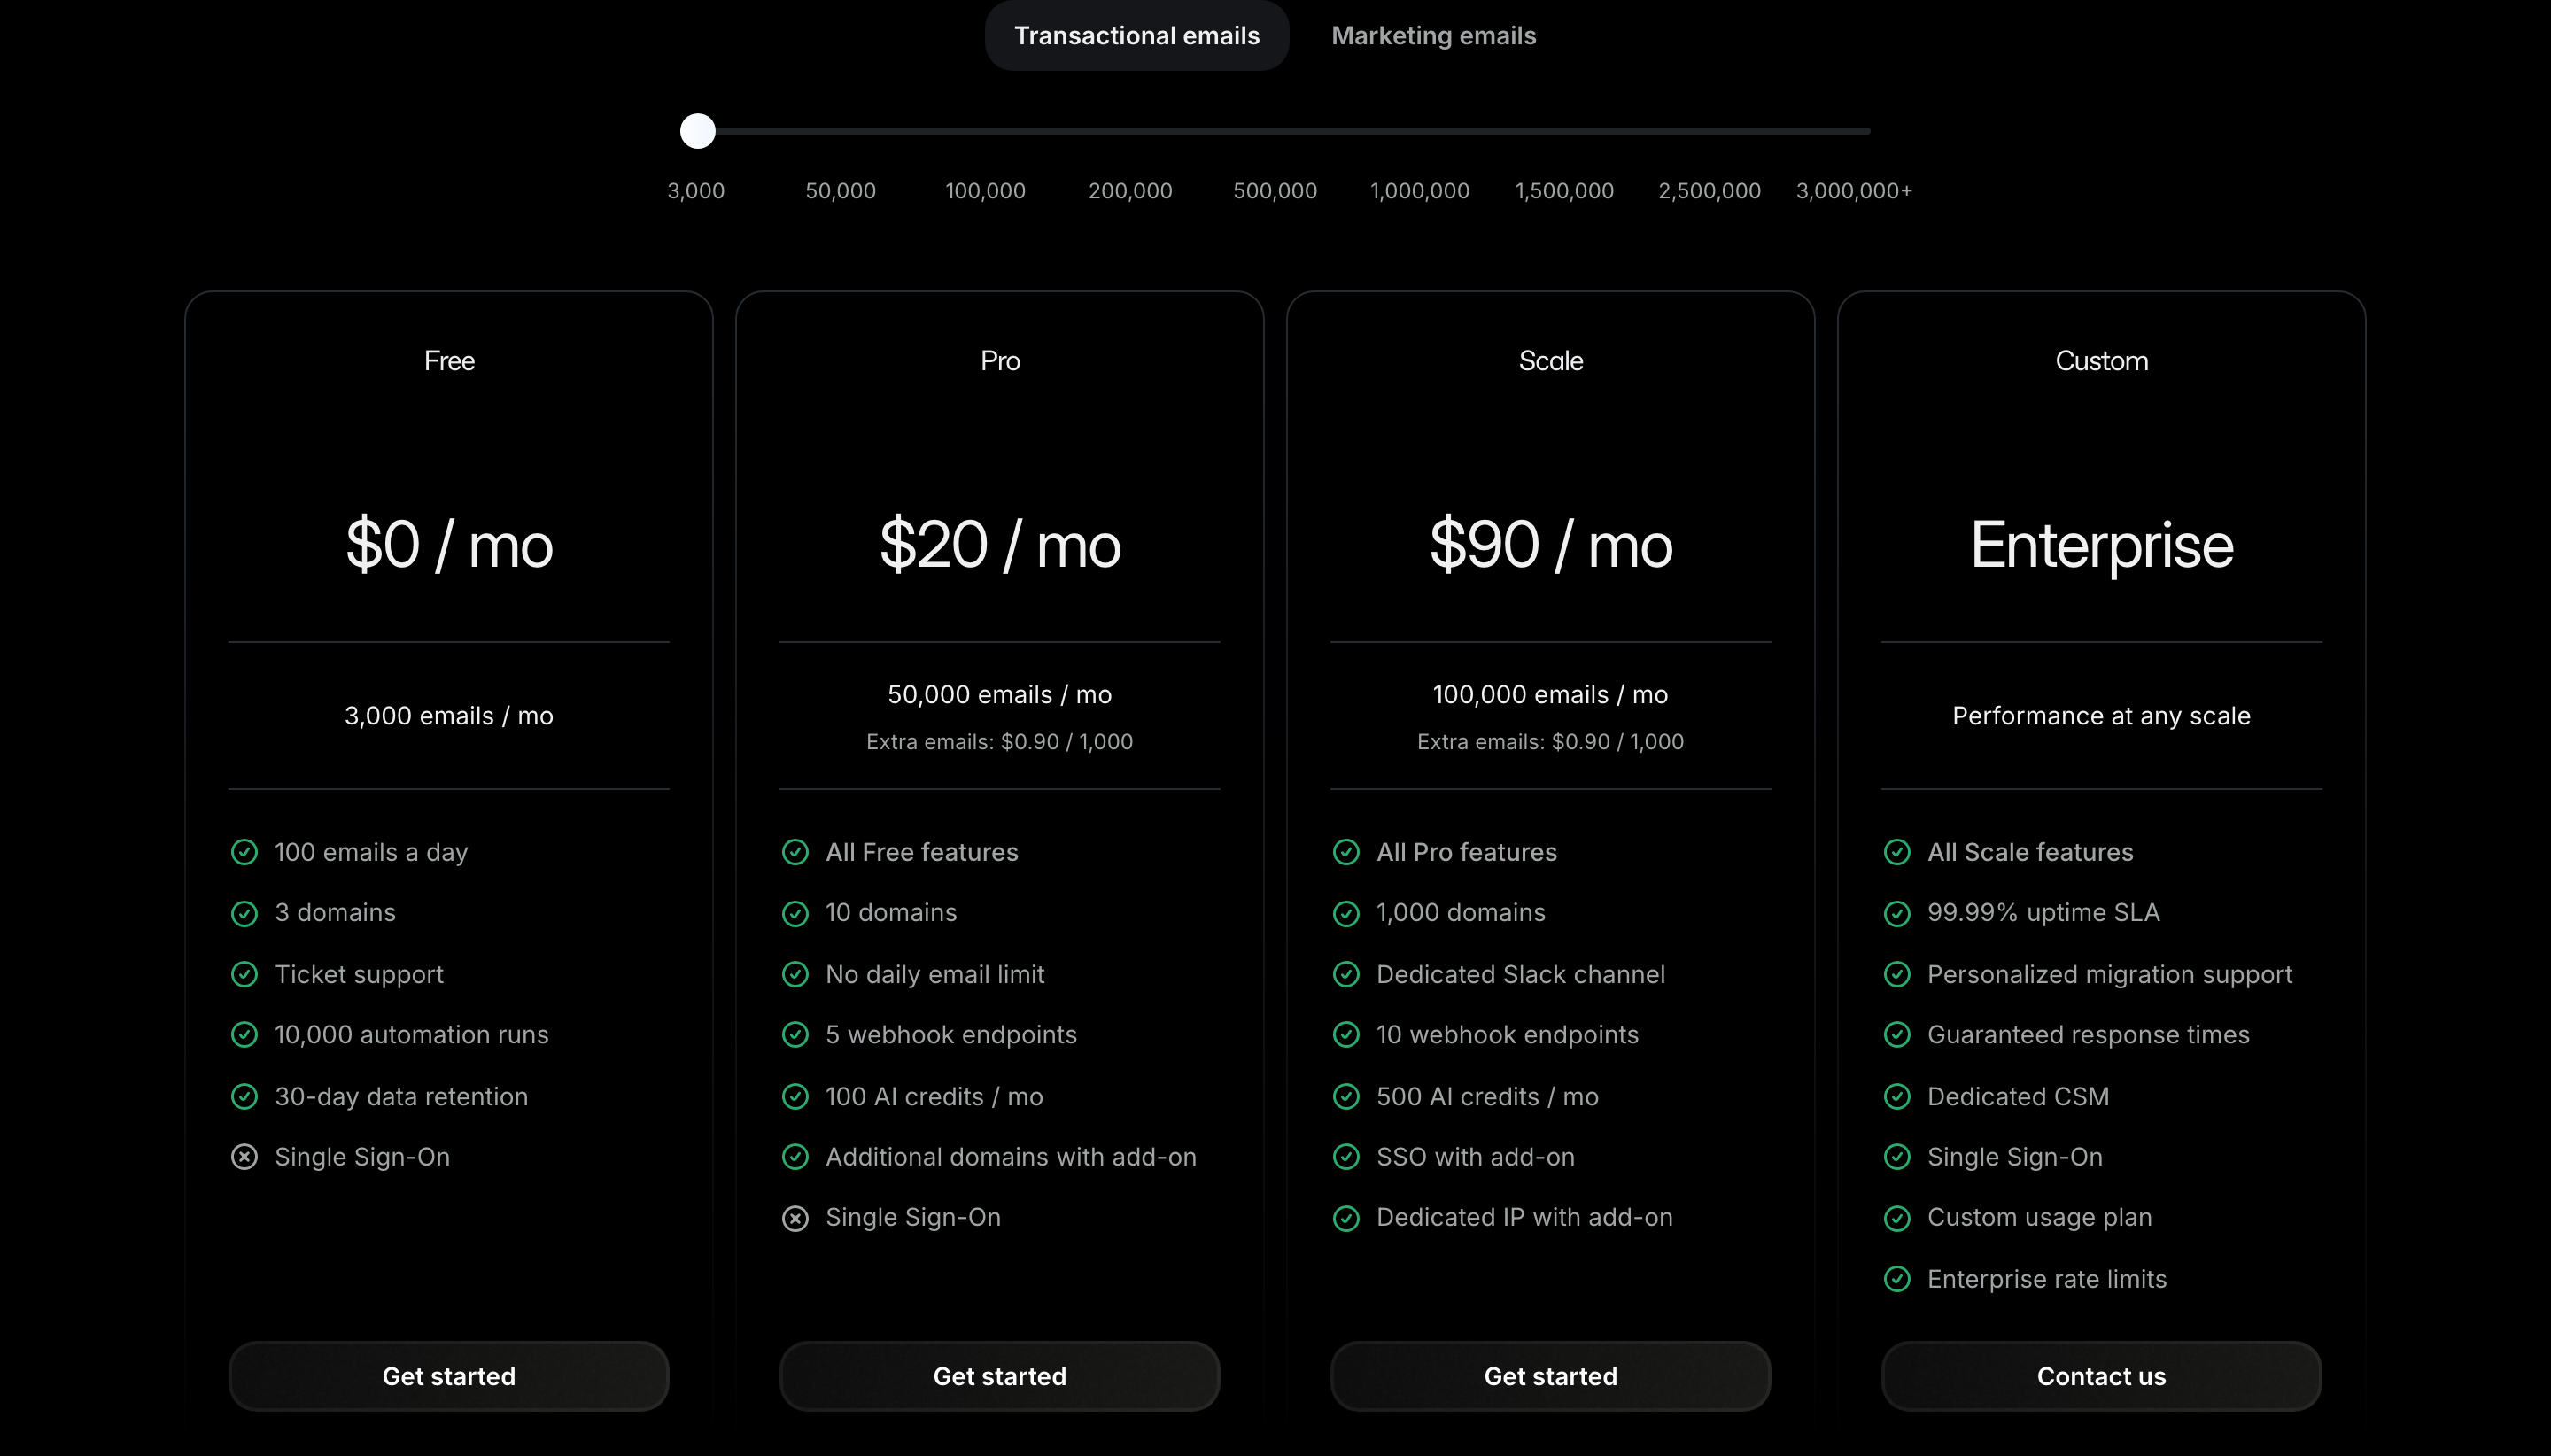
Resend pricing section with email-type tabs, a volume slider and Free, Pro, Scale and Custom plan cards
Collection date · · Resend source collection

Resend

Put usage allowances and overages next to the price

What the capture shows
Transactional and marketing tabs sit above a volume slider. The cards show monthly email allowances, overage text for paid self-serve plans, daily limits and different support levels. Custom takes a contact route.
What to adapt and test
Distinguish included volume, overage units and limits so a base subscription does not look like an unlimited total. Keep the chosen product and volume understandable after changing controls.
Limits of the reference
The still does not prove how the slider or tabs update prices, nor current deliverability, support or uptime claims. Those require separate verification.
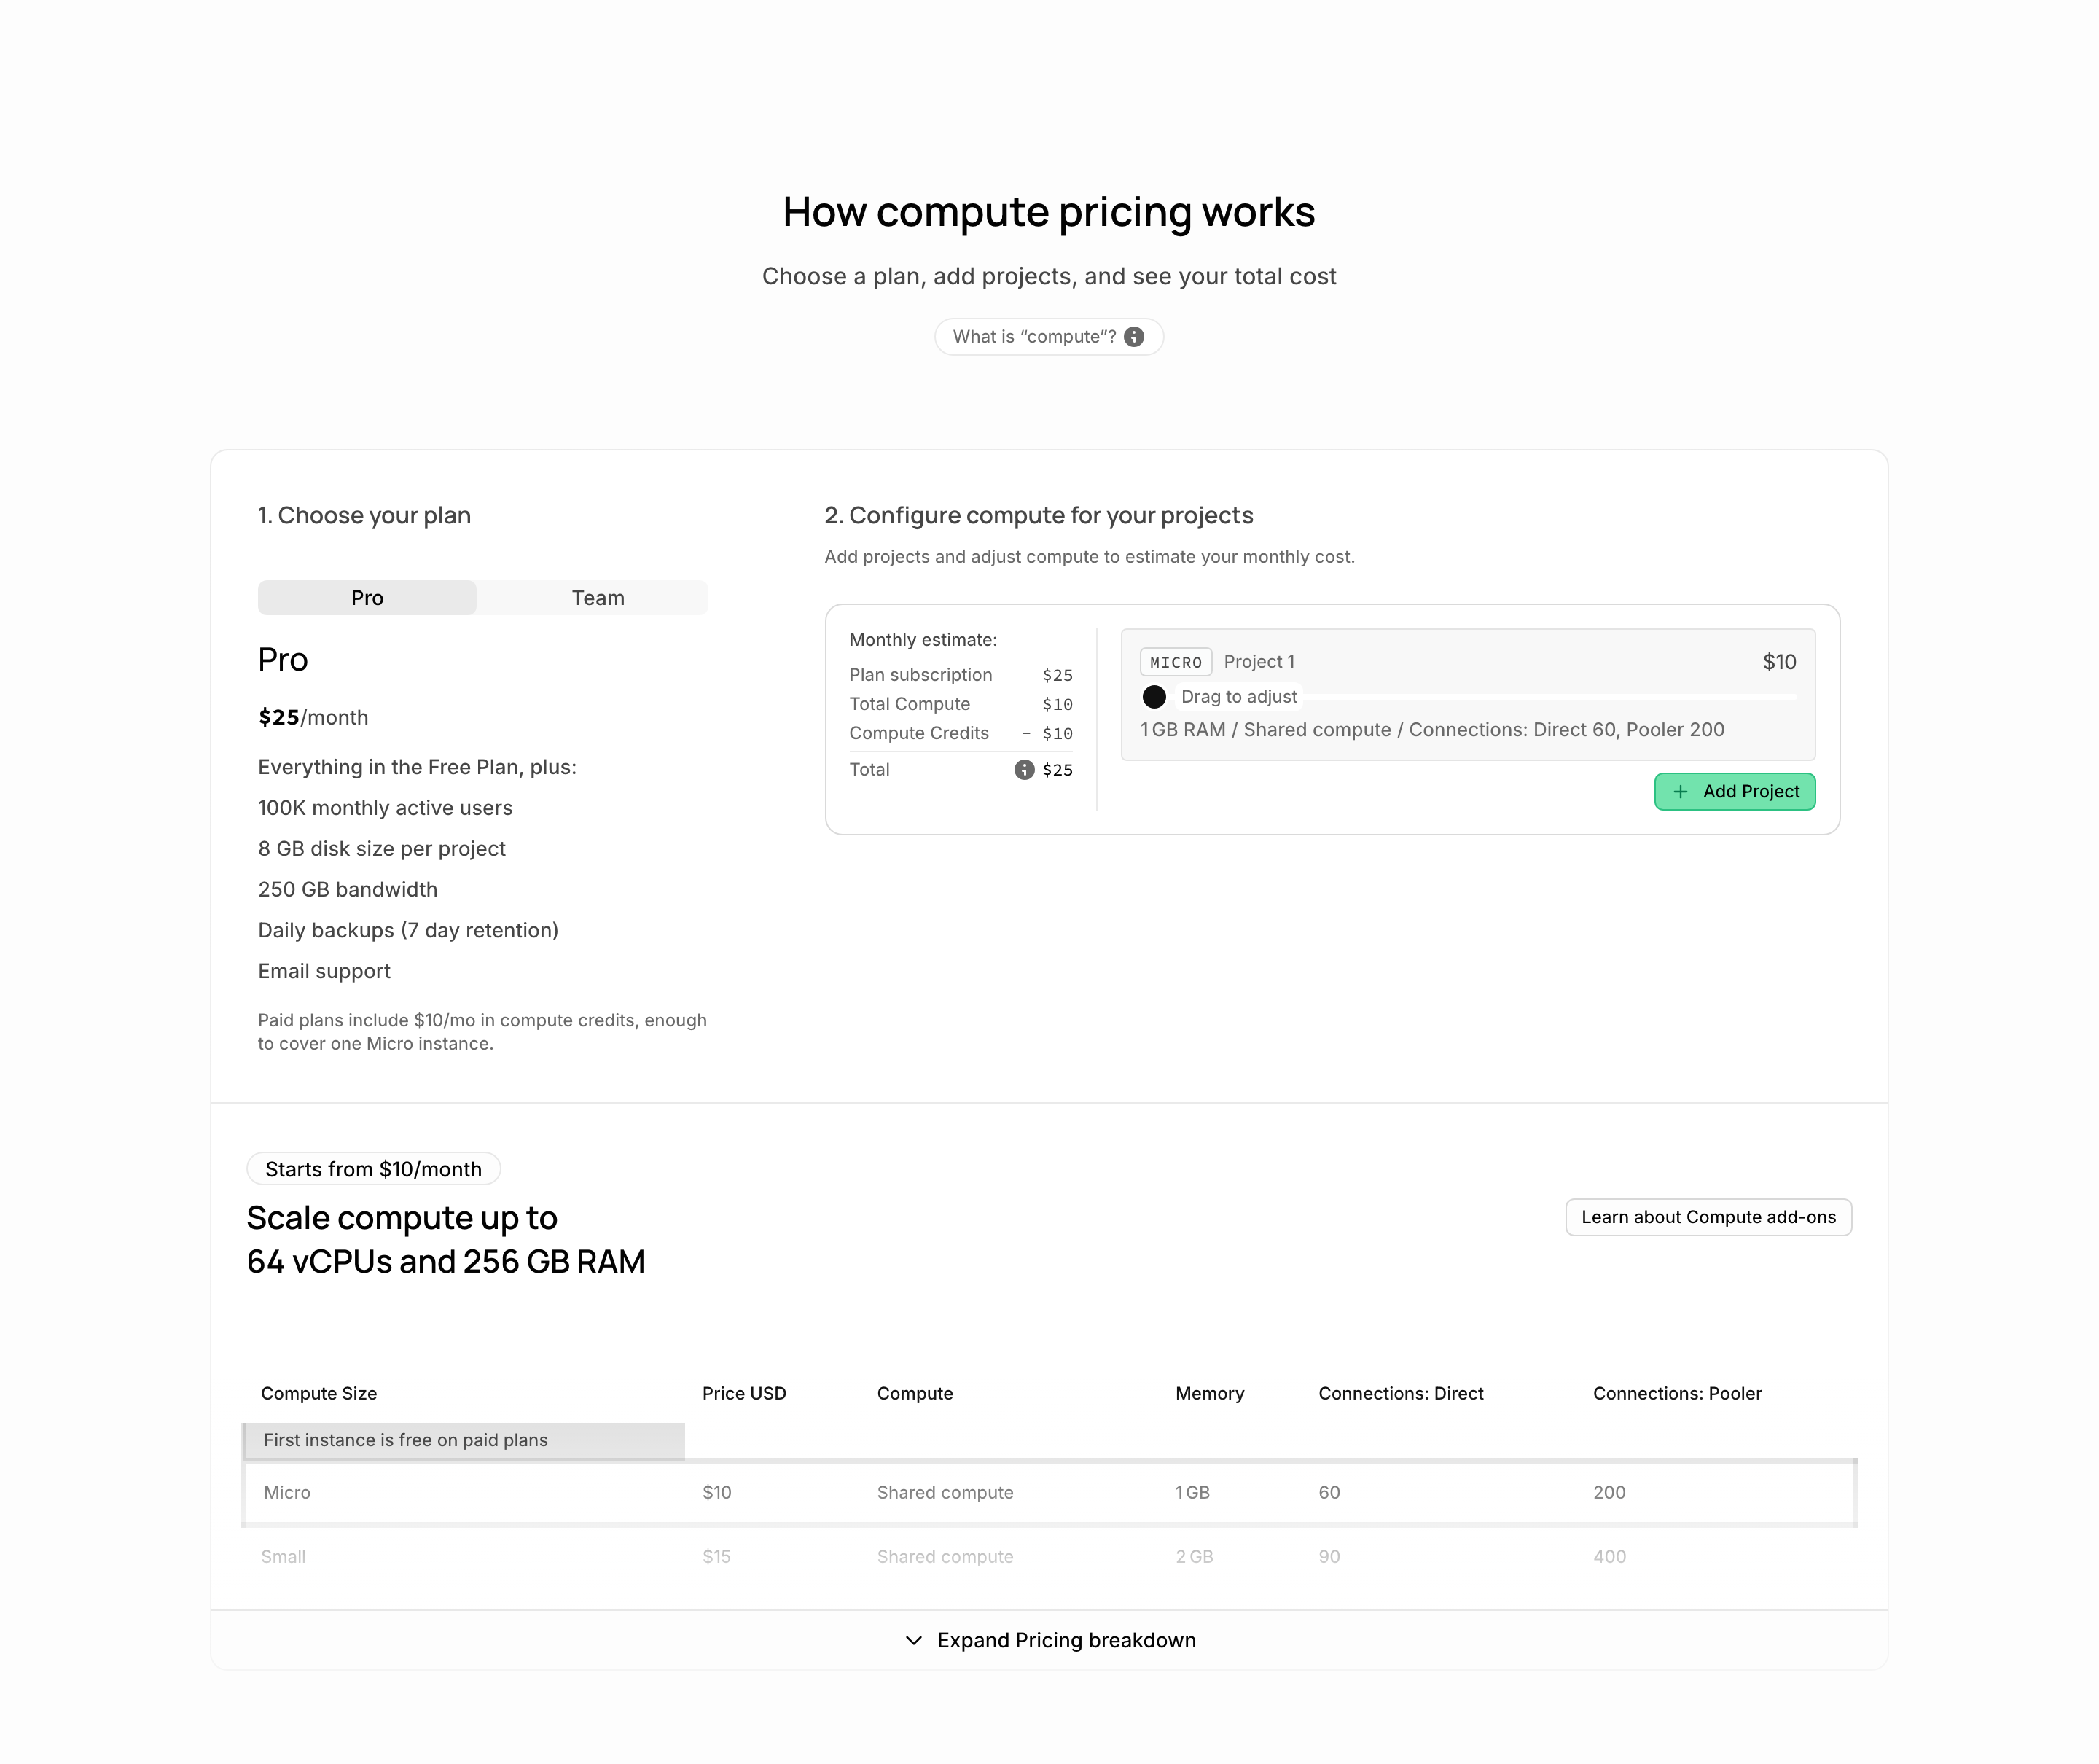
Supabase compute-pricing section with plan selection, a project control, an itemized monthly estimate and an expandable breakdown
Collection date · · Supabase source collection

Supabase

Break an estimate into subscription, compute and credits

What the capture shows
A plan selector sits beside a project configuration area. The estimate separates subscription, compute and a credit before showing a total. An add-project control, a drag-to-adjust affordance and a collapsed breakdown appear nearby.
What to adapt and test
If cost depends on configuration, show the components of the estimate and what each control changes. Label assumptions, credits and exclusions rather than suggesting a fixed guaranteed bill.
Limits of the reference
Only one configuration and estimate are visible. Calculator correctness, additional projects, keyboard control and the expanded breakdown are not established.
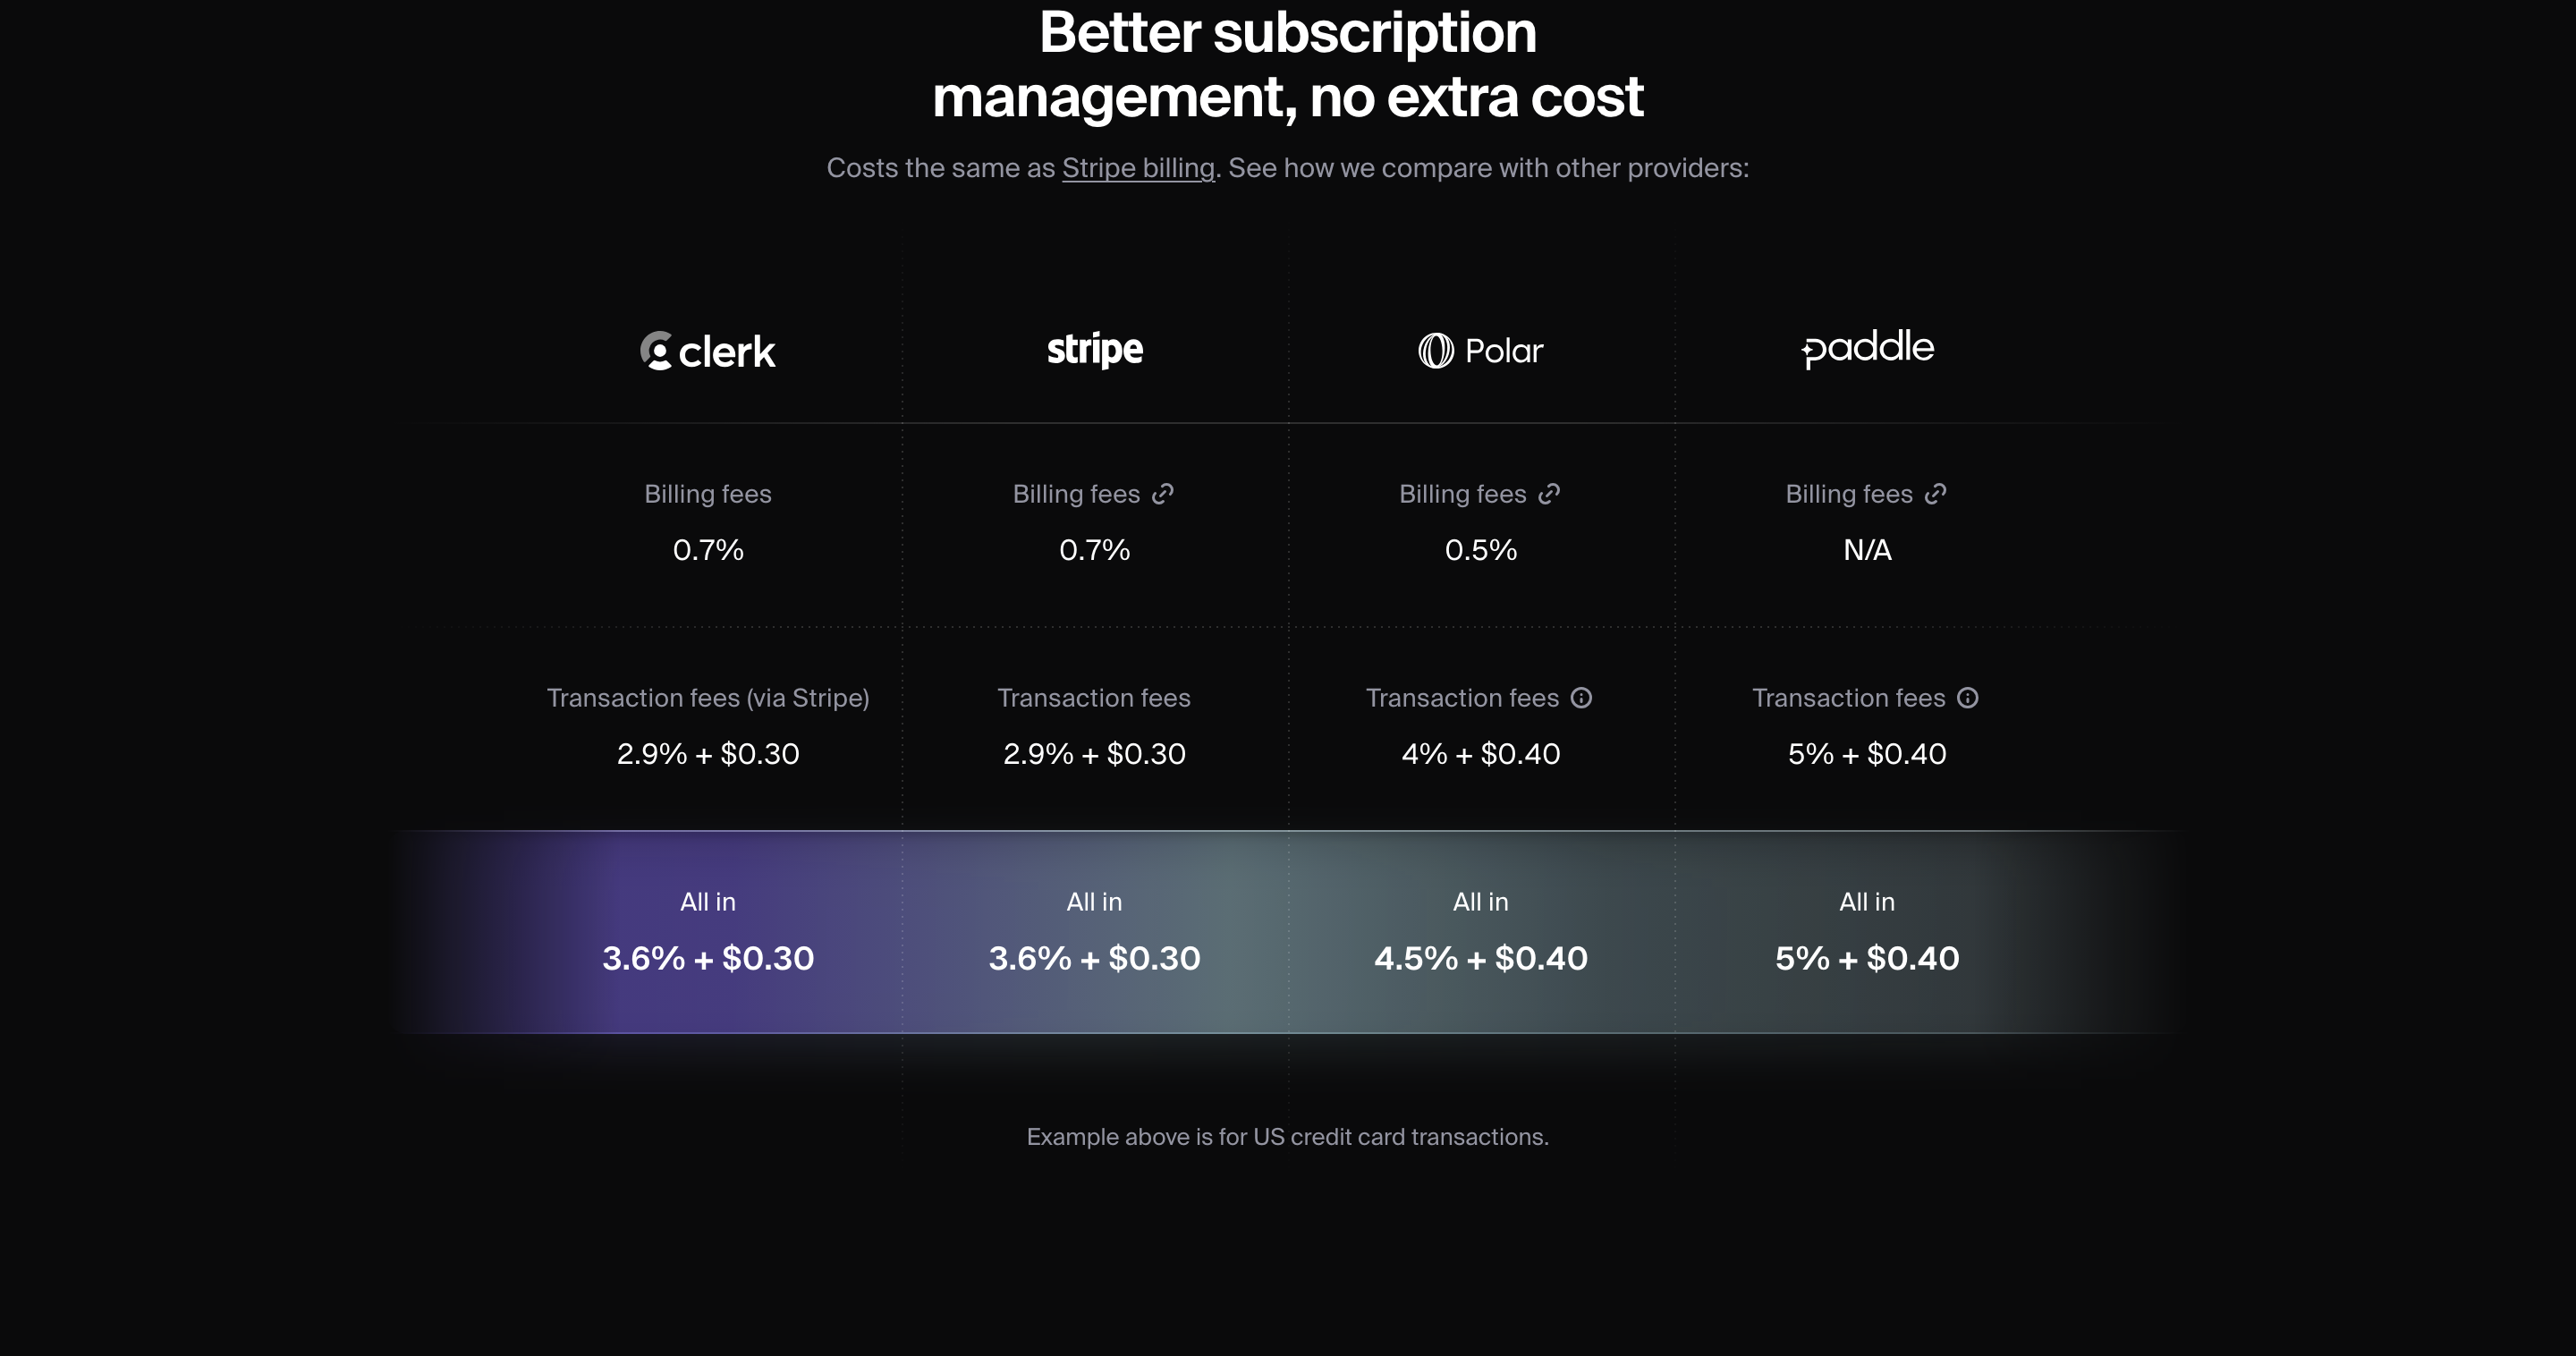
Clerk billing comparison with provider columns and separate billing-fee, transaction-fee and combined-fee rows
Collection date · · Clerk source collection

Clerk

Separate fee categories in a comparison

What the capture shows
Provider columns are compared across billing fees, transaction fees and an emphasized combined row. A note below limits the illustrated example to US credit-card transactions.
What to adapt and test
Name the fee basis and scope before comparing totals. Fixed charges and percentage charges need different units, and region or payment-method conditions belong beside the example.
Limits of the reference
These are historical third-party comparison claims, not independently verified current fees or a recommendation of the cheapest provider. Do not republish them as your own verified price research.
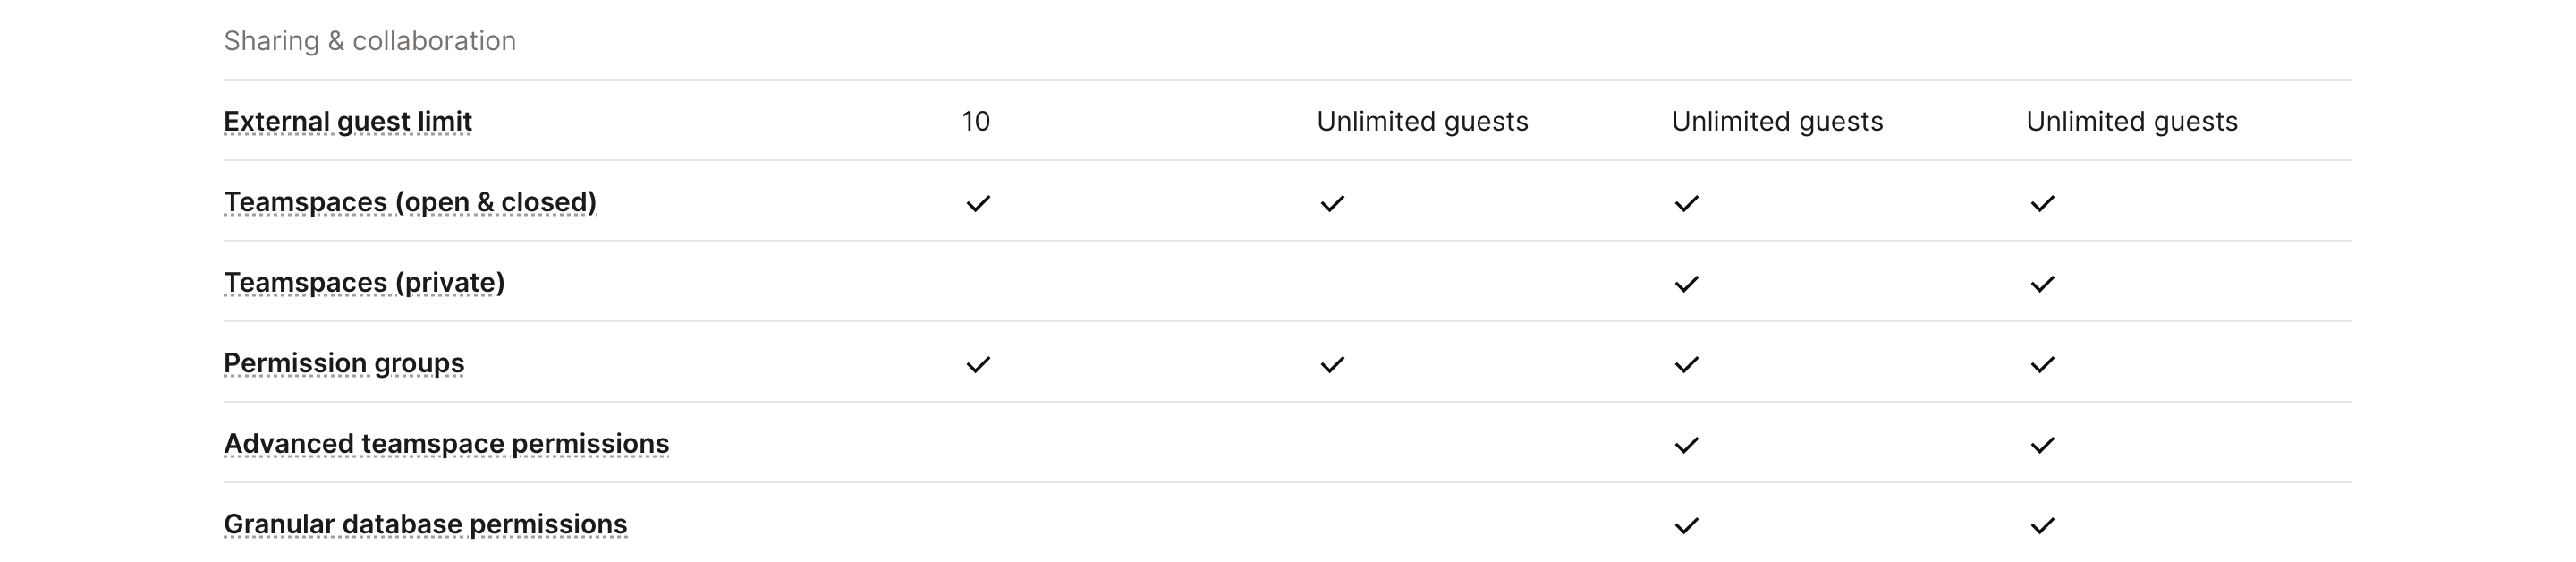
Notion sharing-and-collaboration comparison excerpt with guest limits and permission rows across four columns
Collection date · · Notion source collection

Notion

Keep feature rows interpretable when the table gets long

What the capture shows
A compact matrix compares guest limits and permission features with numbers, words and checks. The section crop does not include the tier headers, so it cannot identify the plan names for each column on its own.
What to adapt and test
Keep column headers available through sticky headers, repeated labels or a meaningful narrow-screen layout. Explain unavailable features in words as well as symbols.
Limits of the reference
This is a table excerpt, not the complete pricing page. Do not assign its columns to tiers or infer live feature availability from the cropped image.

Look beyond the isolated pricing table

These two pricing-page first views add navigation, a value headline and plan framing. They are opening viewports, not entire-page screenshots. The full pricing-page reference gallery leads to the wider collections.

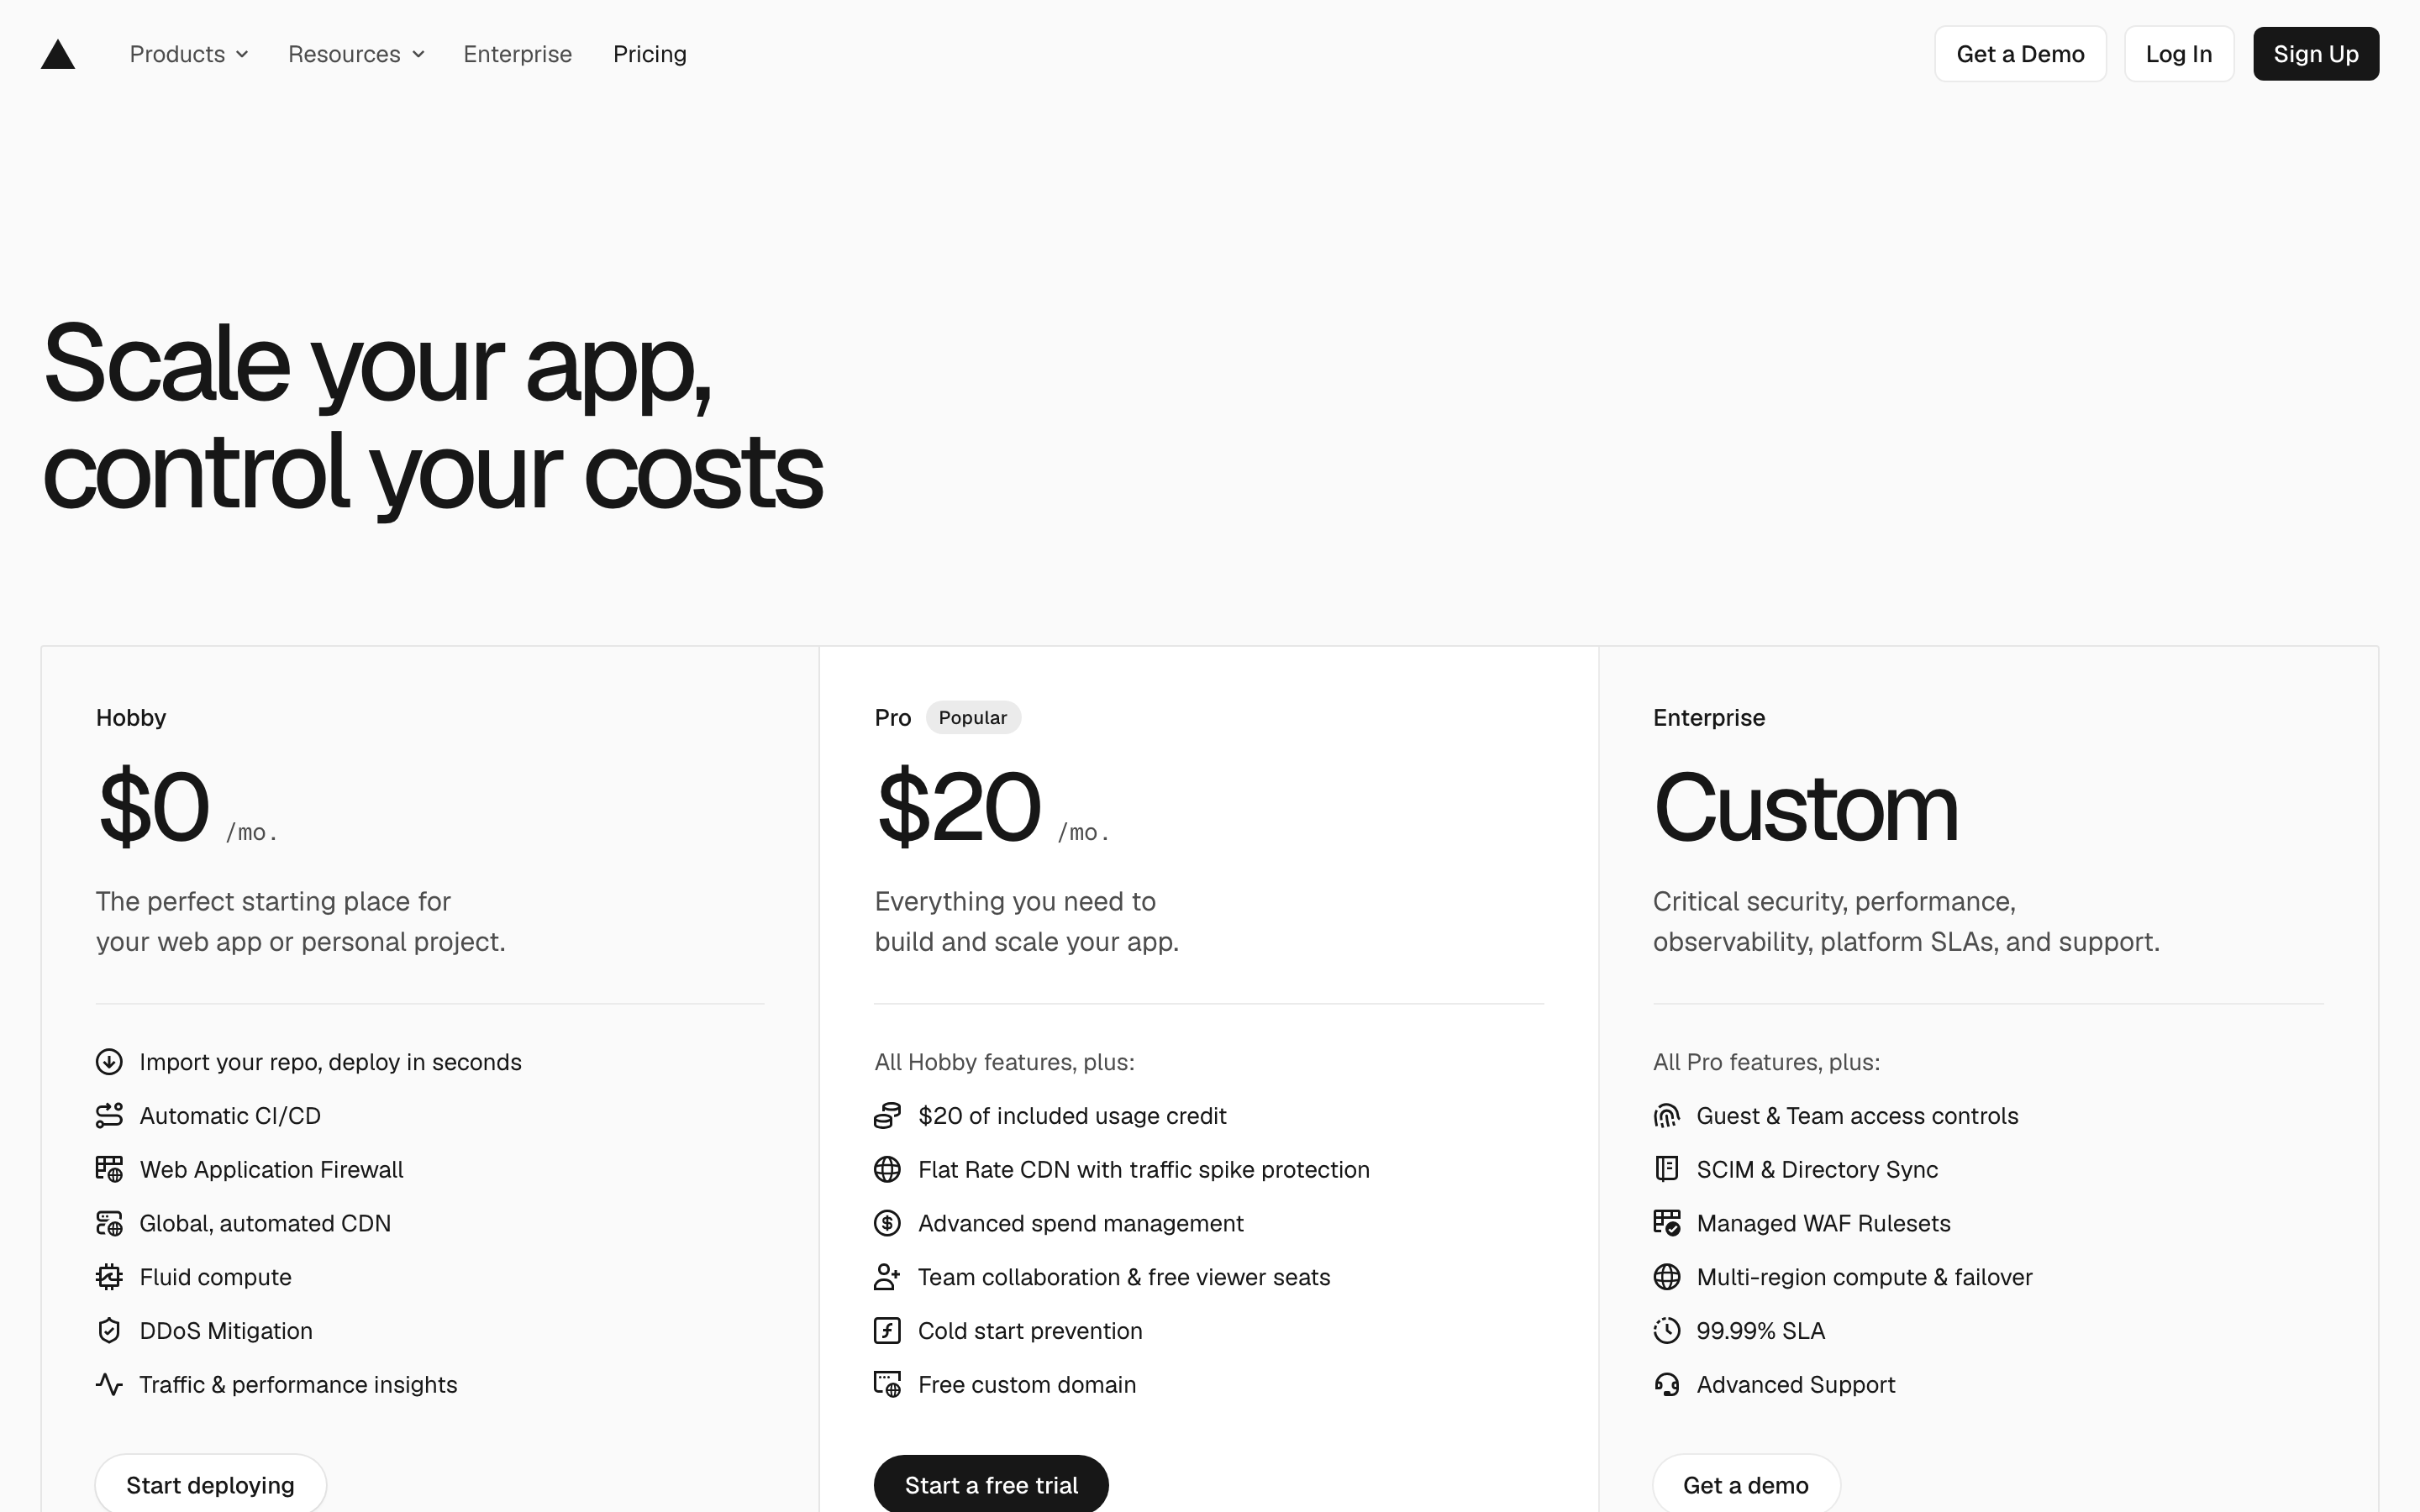
Vercel pricing-page first view with navigation, a value headline and Hobby, Pro and Enterprise cards

Vercel: opening page context

The opening viewport gives a value headline, plan descriptions and separate deploy, trial and demo actions before the later detail. It shows page framing that an isolated table crop omits.

This is the first captured viewport, not a screenshot of the entire page or proof that any trial or demo action works.

Open the source collection
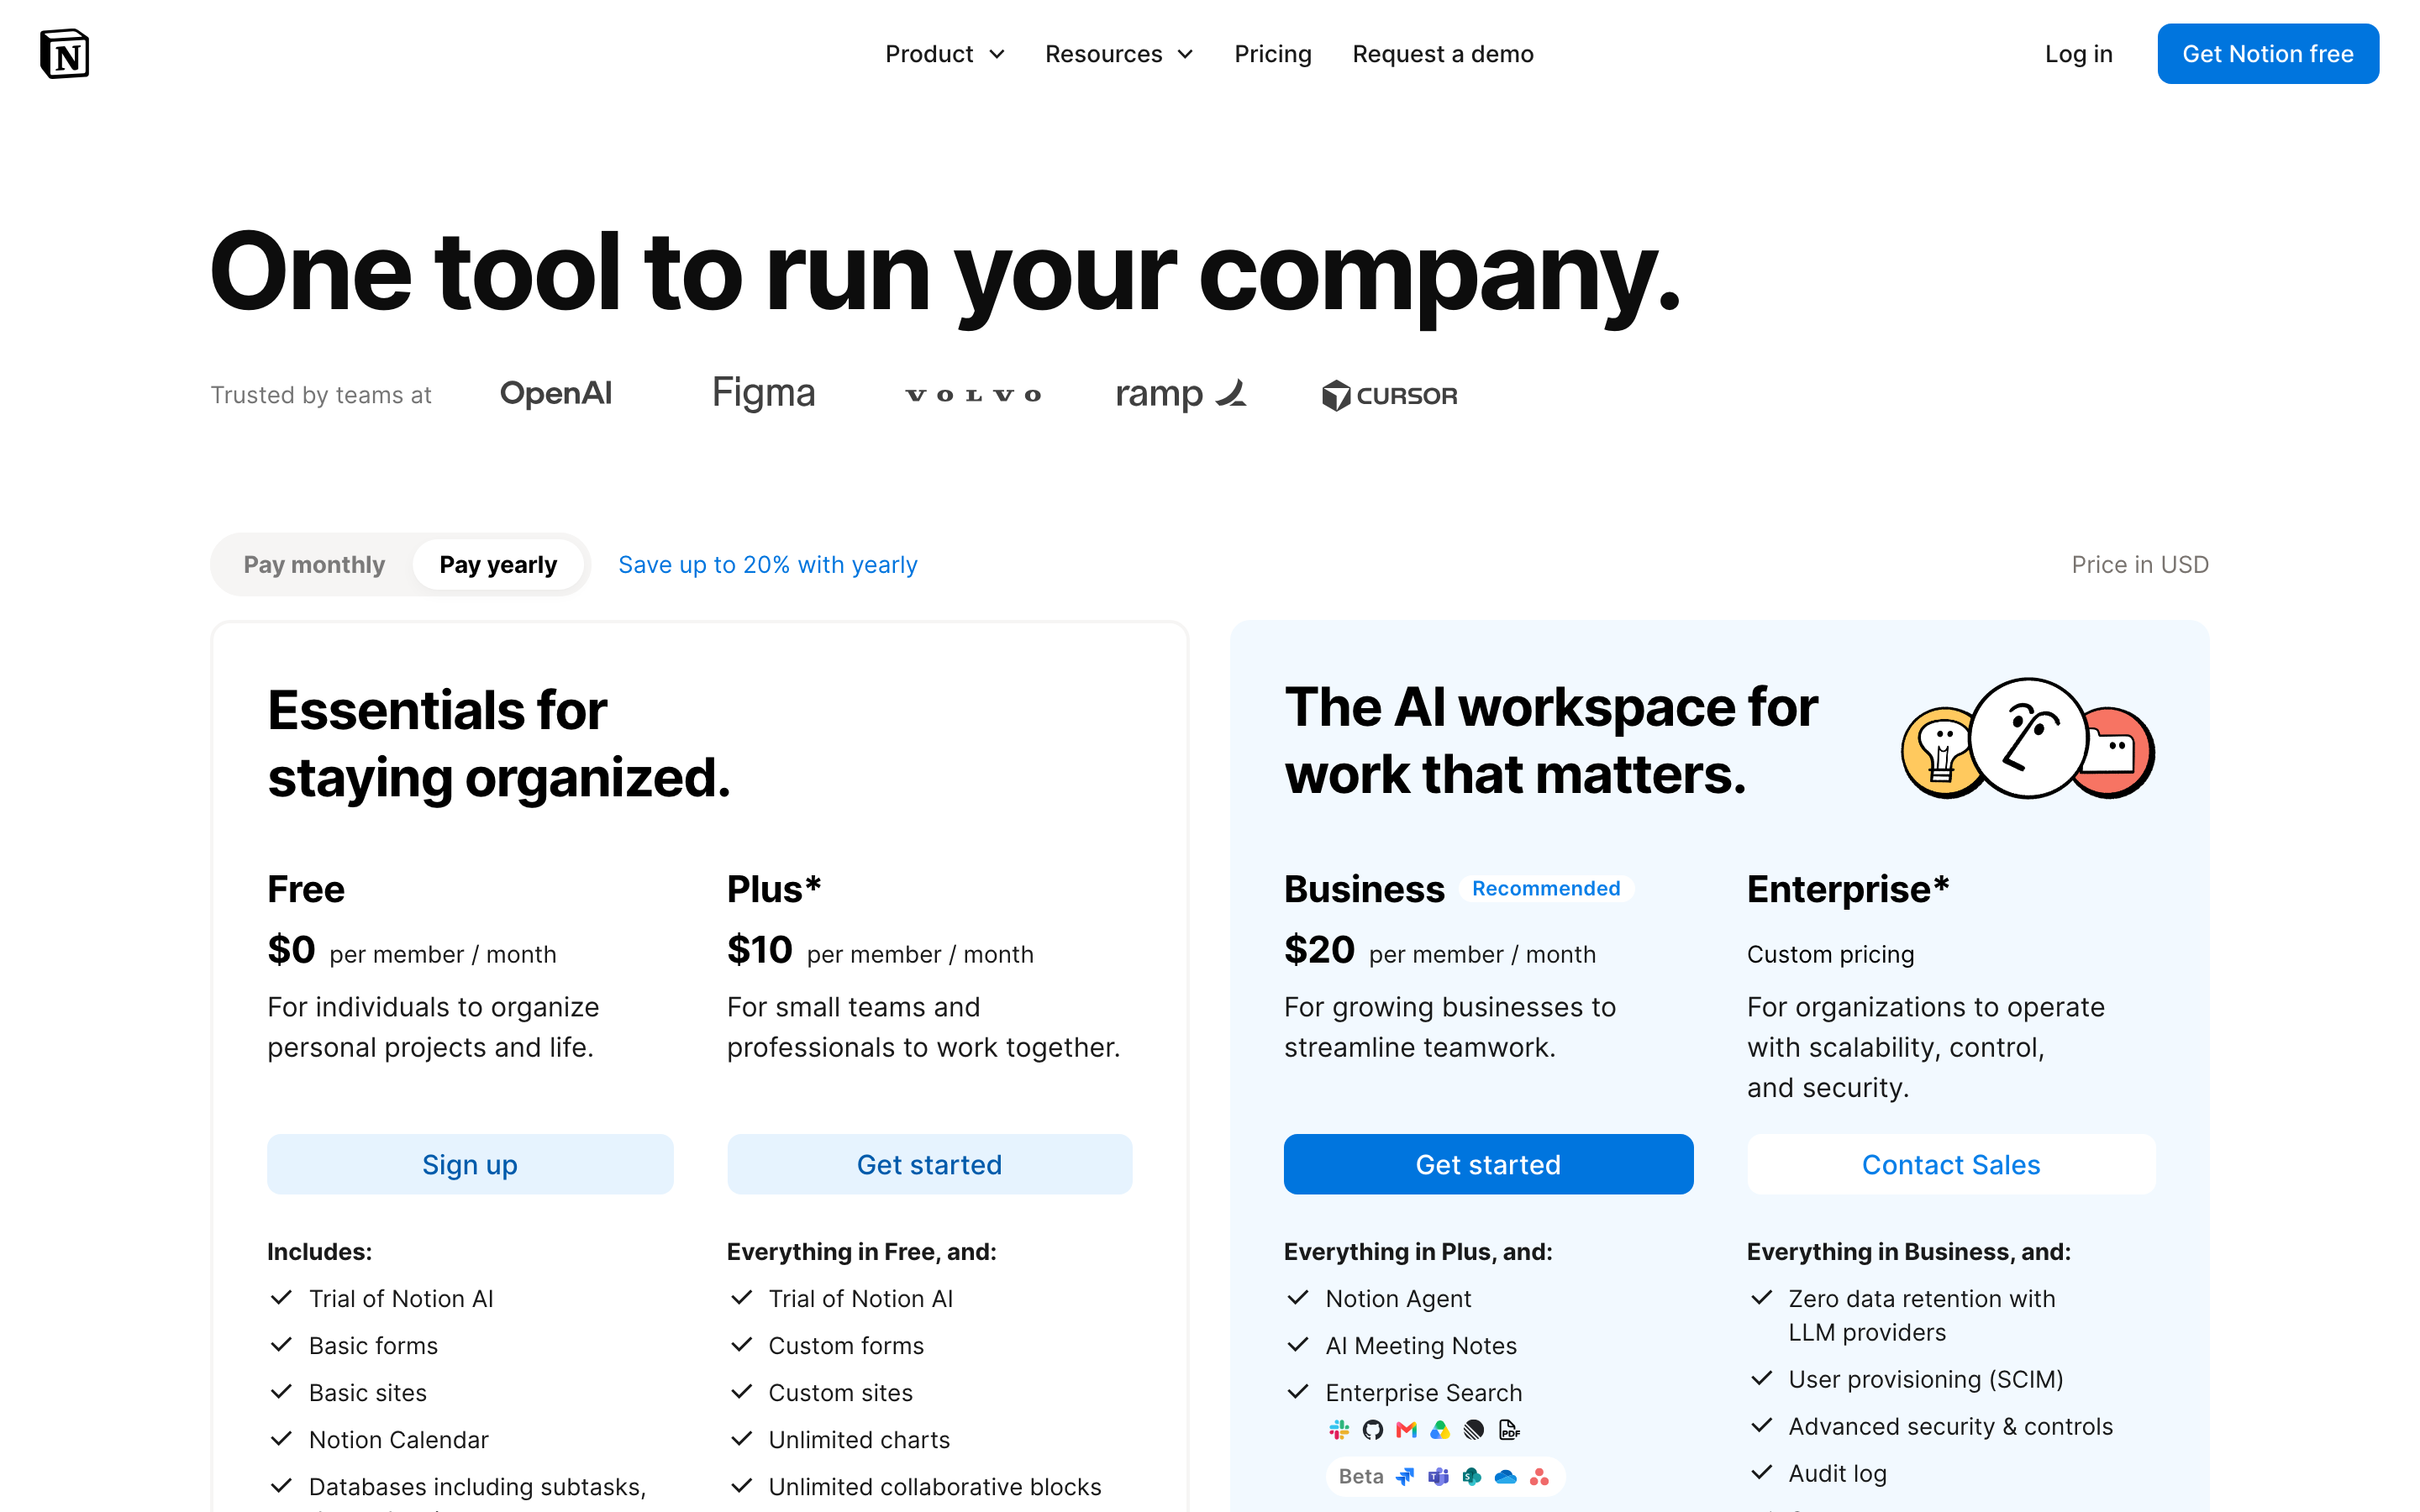
Notion pricing-page first view with a yearly billing control, USD label and plans grouped into two benefit-led panels

Notion: opening page context

The opening view groups plans under two benefit statements, places a yearly billing choice and USD label above them, and gives Business a recommendation label. This provides context for the separate comparison excerpt.

The saving, recommendation and displayed amounts are historical source copy, not verified current terms or measured outcomes.

Open the source collection

A pricing page design checklist

  • Define who each plan serves and make the difference understandable before listing every feature.
  • Keep price, currency, billing unit and actual charge schedule together; label the selected monthly or annual state.
  • Show important allowances, overages, seat roles and estimate assumptions before someone commits.
  • Distinguish purchase, trial and sales routes. Compare CTA examples and sign-up page references for the next step.
  • Check table headers, long plan names, keyboard controls, errors and narrow-screen reading. Use checkout patterns when a price choice becomes a transaction.
  • Verify current source terms independently. This page supplies pricing page inspiration, not procurement advice.

Try an original billing clarity example

Invented USD prices for one example plan: $18 per seat/month billed monthly, or $15 per seat/month billed annually. This local demo does not create an account, start a trial, charge money or represent UI Discovery pricing.

Billing period

Enter a whole number from 1 to 50.

Displayed monthly equivalent
$18 per seat / month
Example charge for 1 seat
$18 USD billed monthly
Assumptions
No taxes, add-ons, overages or mid-cycle changes included. No checkout is connected.

Brief an original pricing interface

This is an editorial starting point, not a native-builder validation. Supply your approved plans and destinations; see the SaaS prompt guide for wider page context.

Build an original pricing interface using my approved plan data.
Show the currency, billing unit, selected period and actual charge schedule.
Keep allowances, overages, role entitlements and exclusions understandable.
Use real trial, purchase or sales destinations. Do not invent a checkout API.
Preserve table headers and action labels at 320px, 390px and desktop.
Test keyboard controls, long copy, invalid quantities and billing changes.
Report the checks performed. Do not copy the reference's assets or prices.

More section types

Festival graphics

Pricing page examples — FAQ

What should a pricing page include?

Explain the audience and purpose of each plan, the price and its unit, the billing schedule, important allowances and the next action. Usage-based products also need assumptions and overage terms. A complete page can add comparison details and focused questions after the first decision.

What is the difference between a pricing page and a pricing table?

A page supplies the surrounding value narrative, navigation, plan choice and supporting detail. A table compares a particular set of prices or features. This guide reviews six section examples and two opening page views; the separate full-page reference gallery links to the wider source collections.

How should monthly and annual billing be shown?

Distinguish a monthly charge from a monthly equivalent billed for a full year. Keep the selected period, currency, unit and charge schedule visible. Test that changing the period updates all relevant amounts and is usable by keyboard. The original demo below the checklist illustrates invented figures, not a source site's current offer.

How do I explain usage pricing or multiple seat types?

Define what is metered, which allowance is included, the overage unit, and which role gets each entitlement. Break estimates into subscription, usage and credits when those are separate. Do not imply the base subscription is a guaranteed total for every configuration.

How can a pricing comparison work on mobile?

Preserve the relationship between plan names, prices, features and actions. Repeated headings, a labeled scrollable table or stacked plan summaries are possible approaches; test them with real content. Desktop screenshots on this page are not evidence of the source sites' mobile behavior.

Are the displayed prices current or these layouts proven to convert?

No. These are historical captures reviewed for visible design patterns, not verified current offers, a purchasing recommendation or measured conversion results. Currency, region, billing conditions and included limits can change. Verify current terms with the source owner before making a purchase decision.

Library updated