
Dashboard design examples and UI references
39 captured dashboard references. Compare navigation, metrics, charts and tables, then read original notes on six selected admin, analytics and CRM demo captures.
Filter
Exact colour










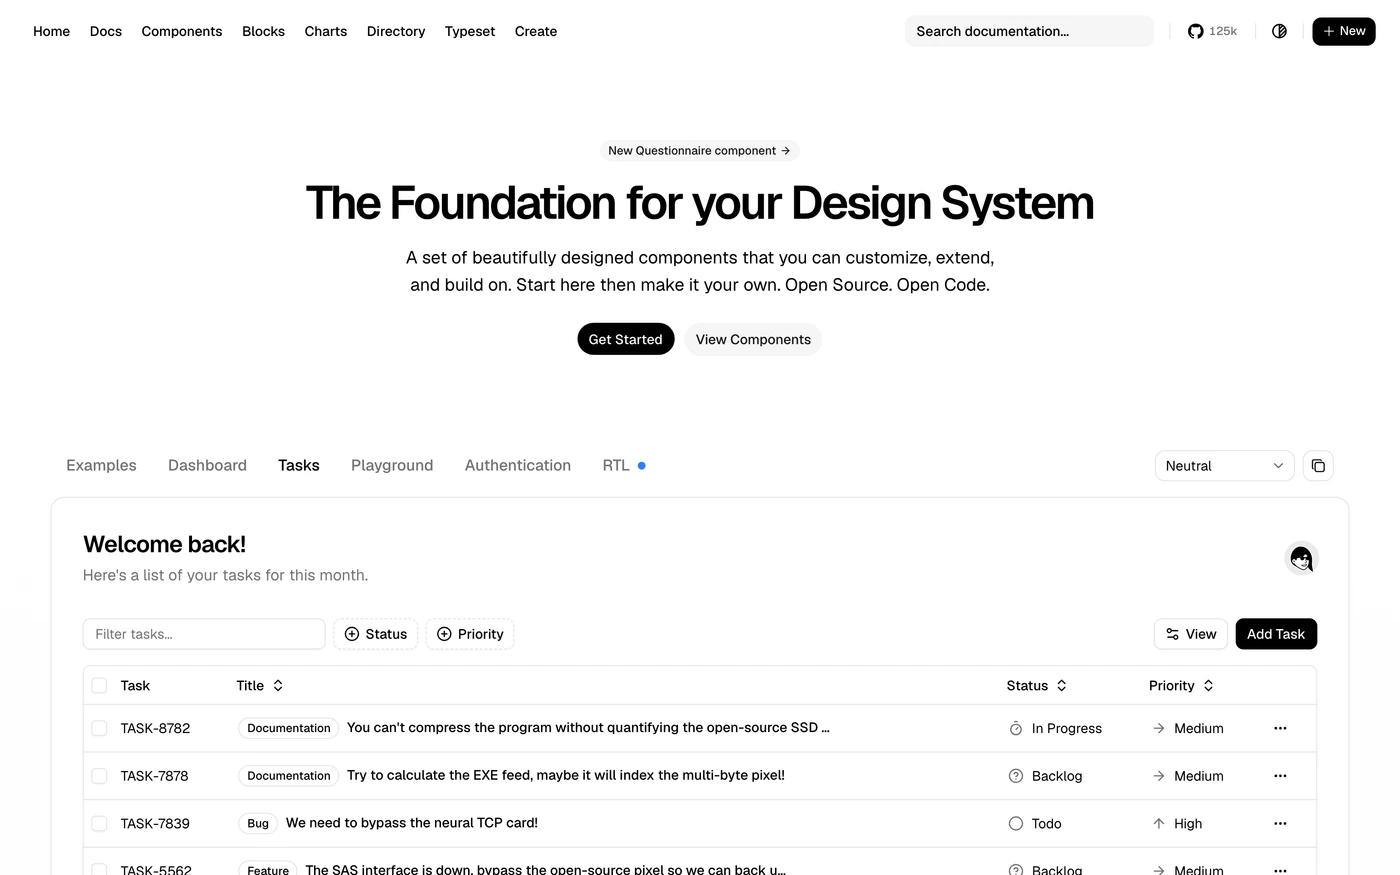

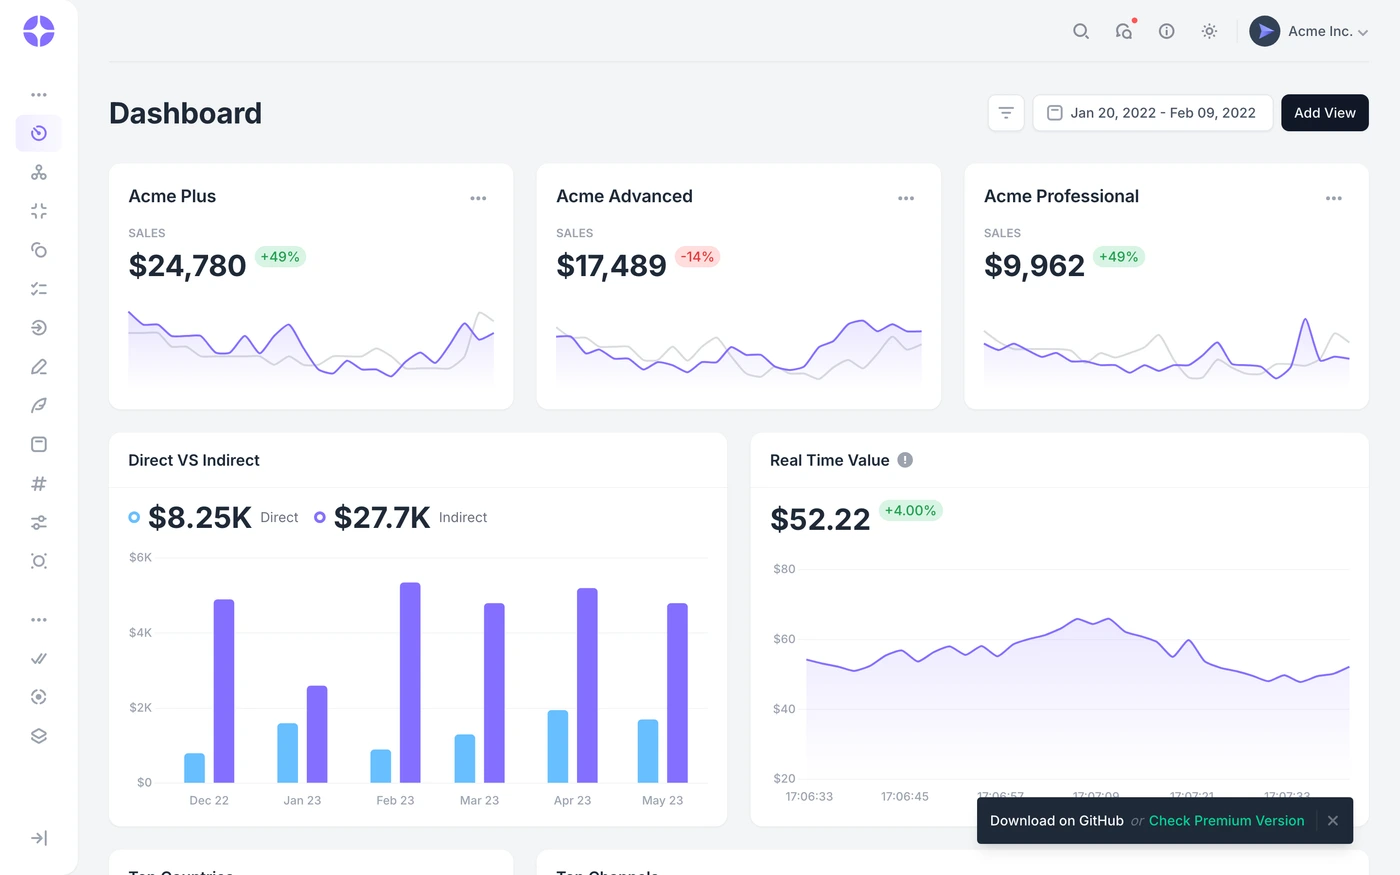

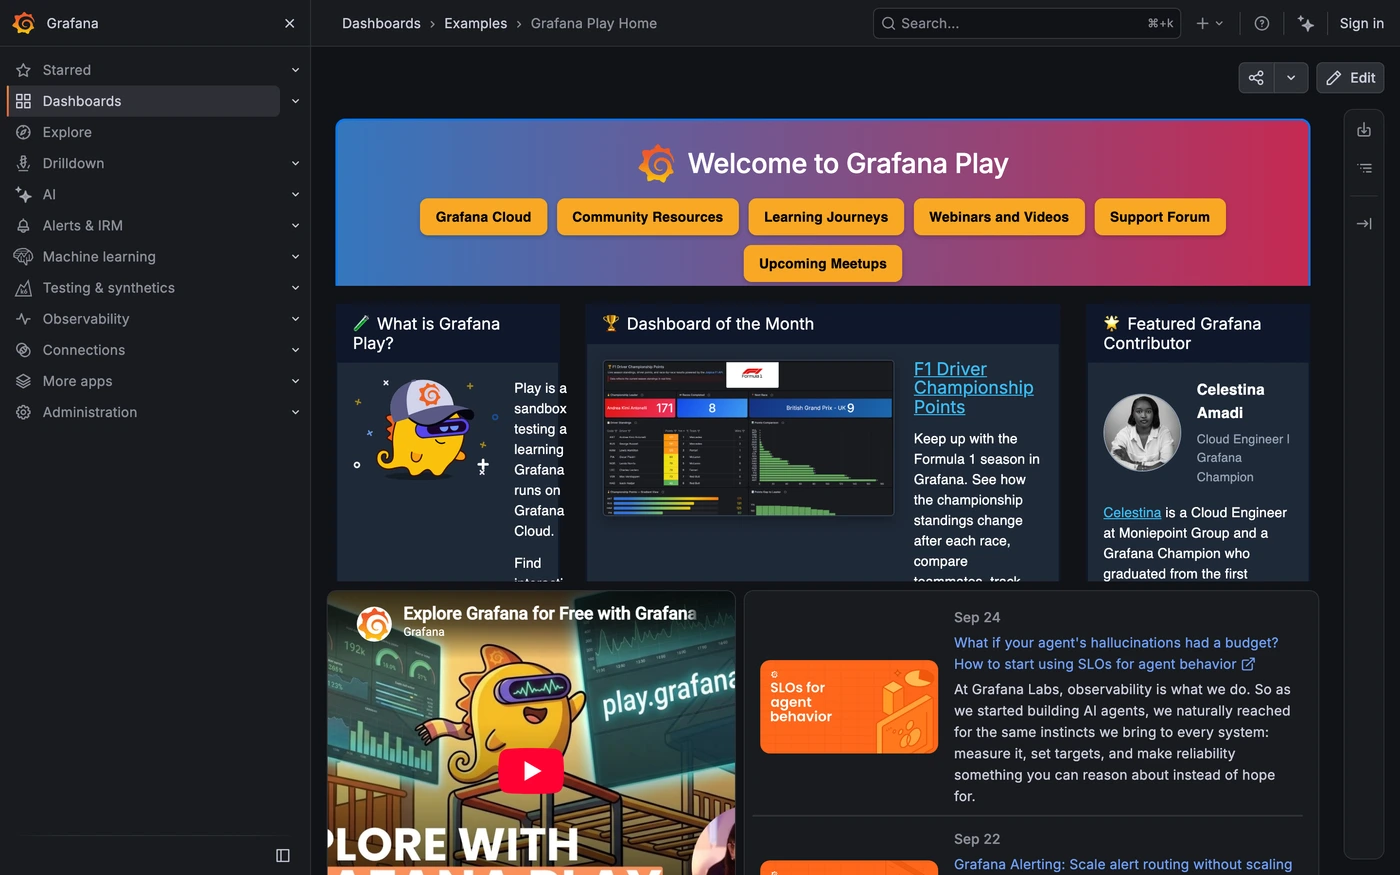

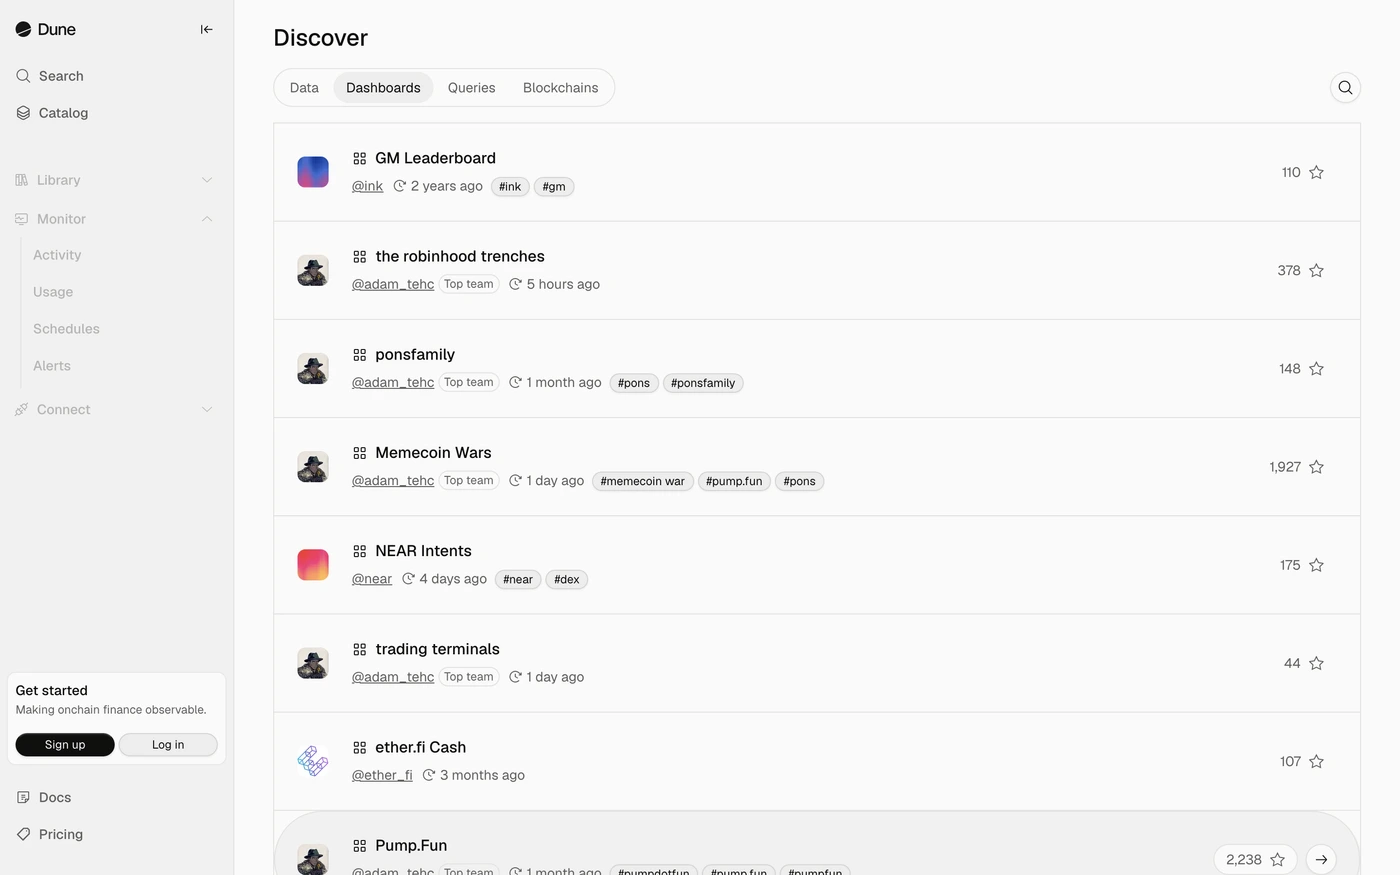





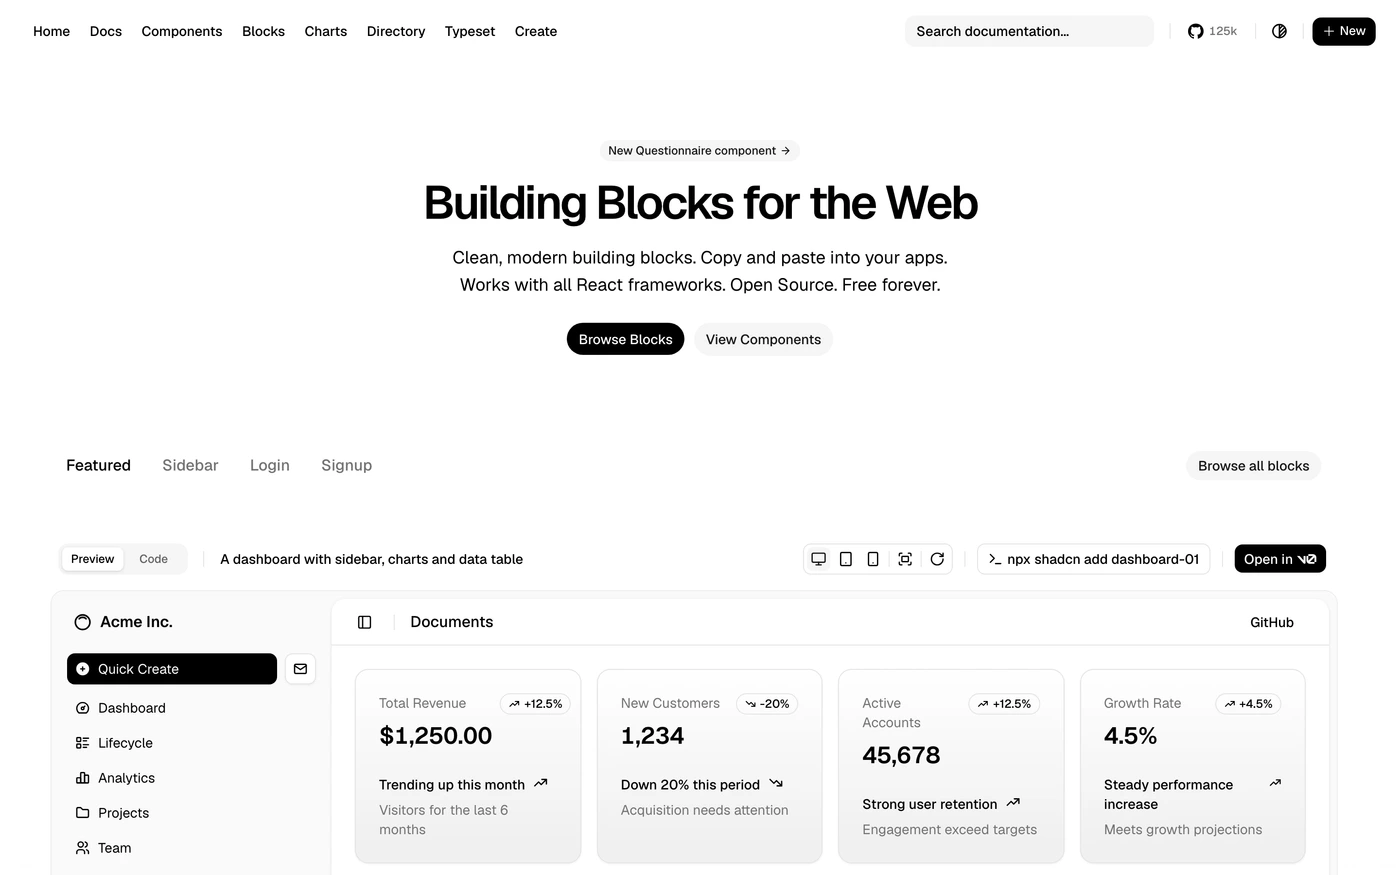


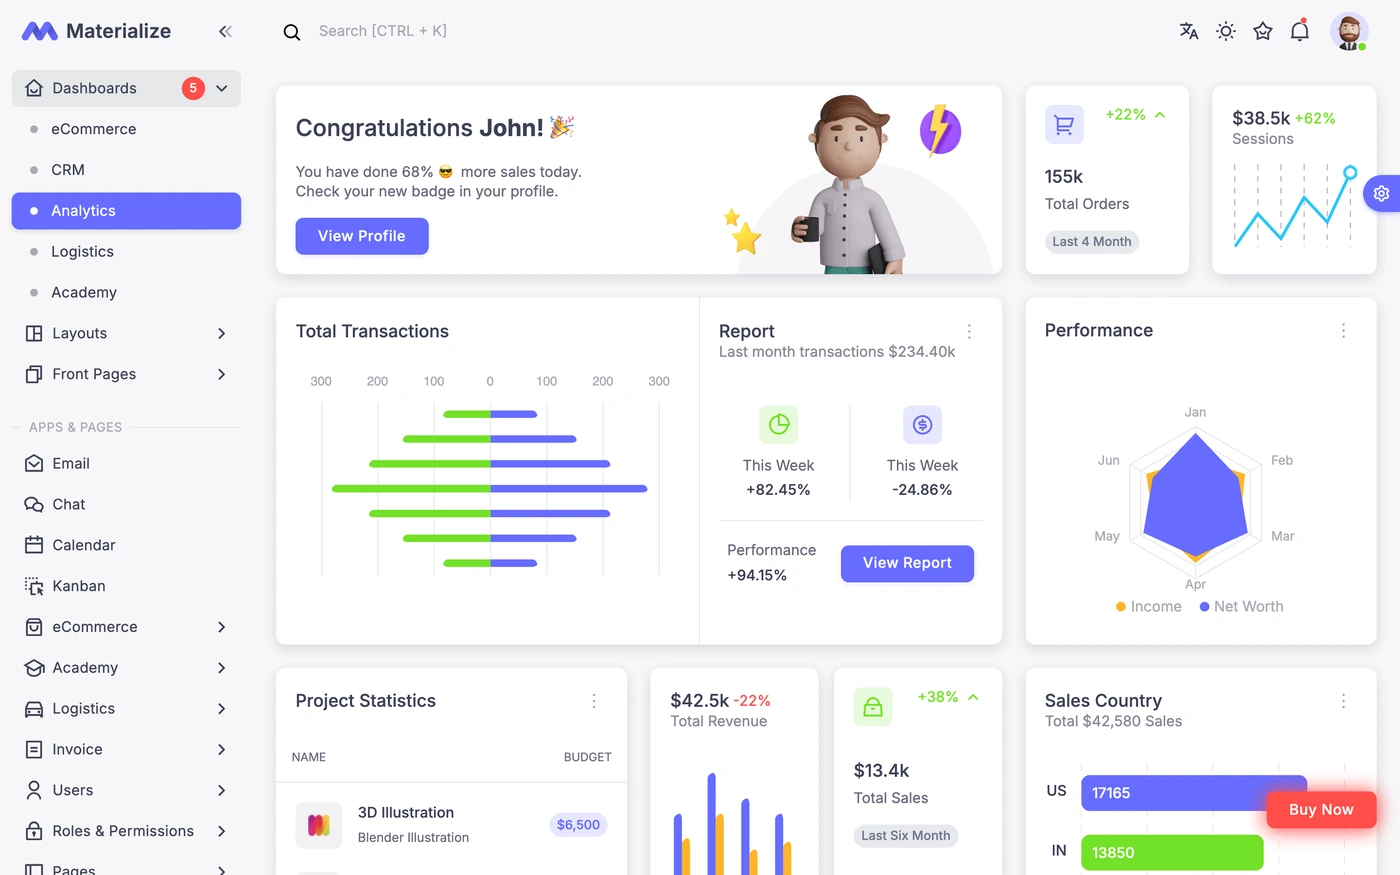
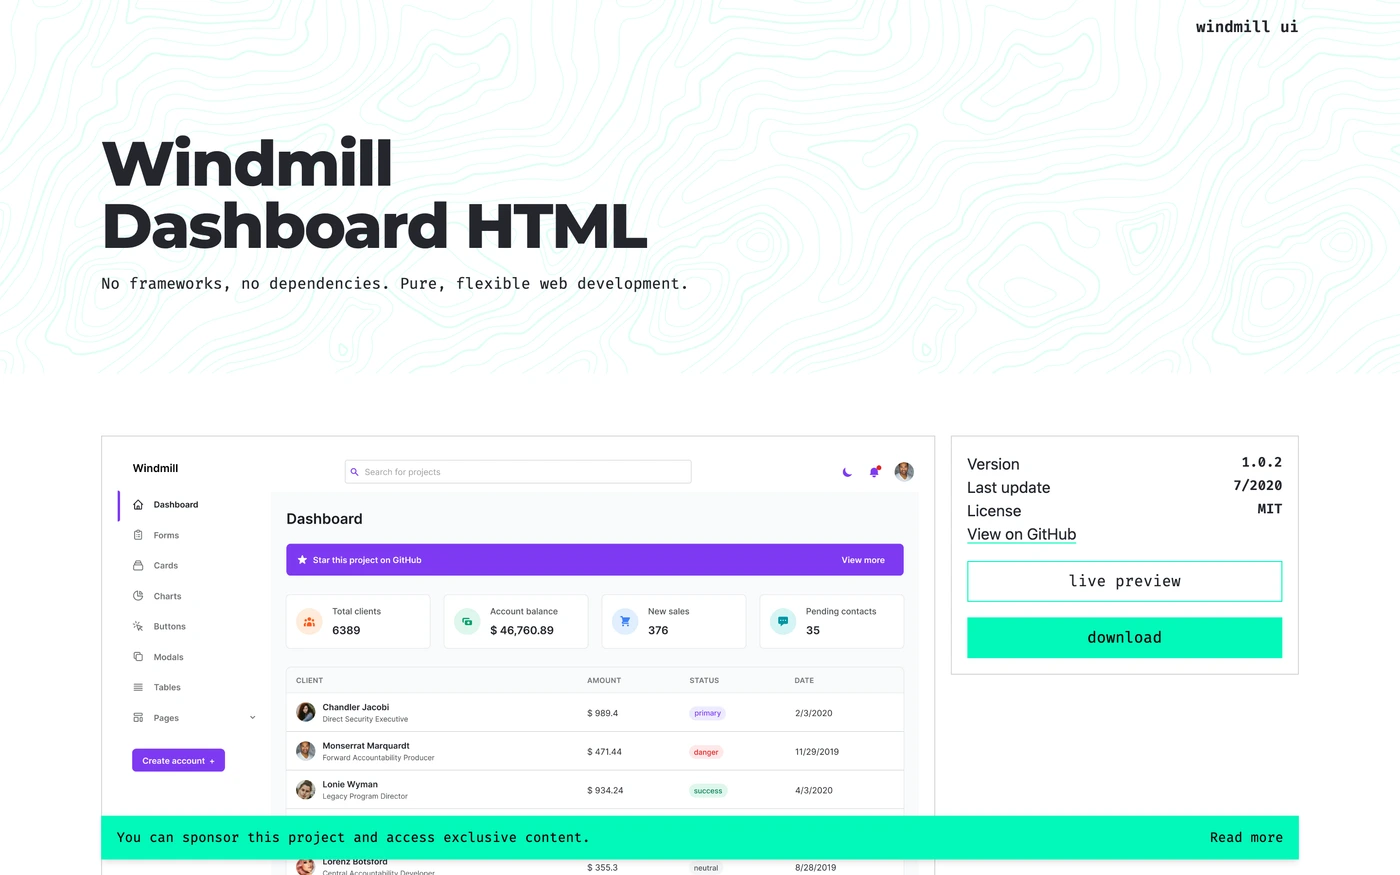








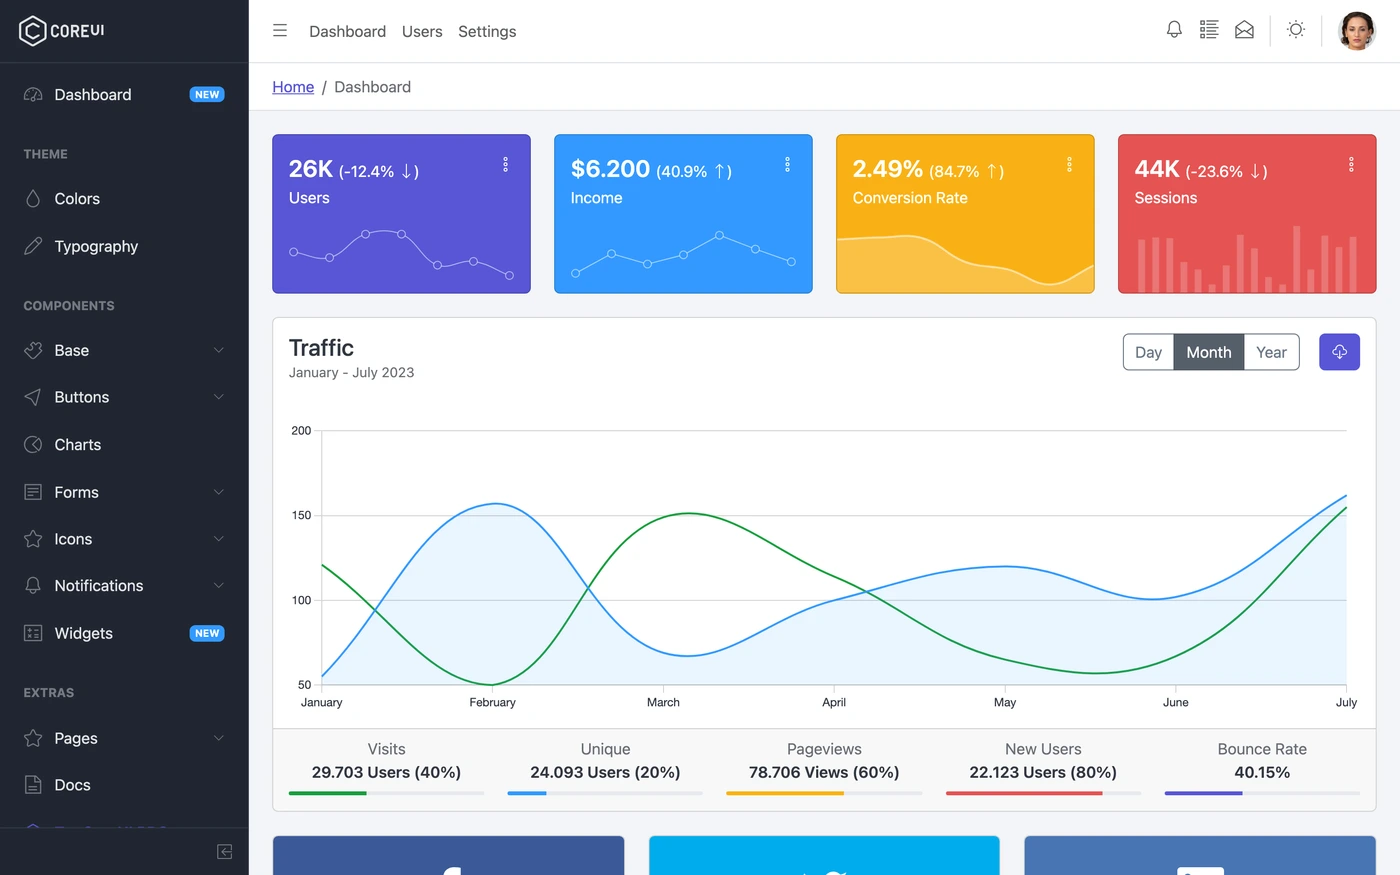

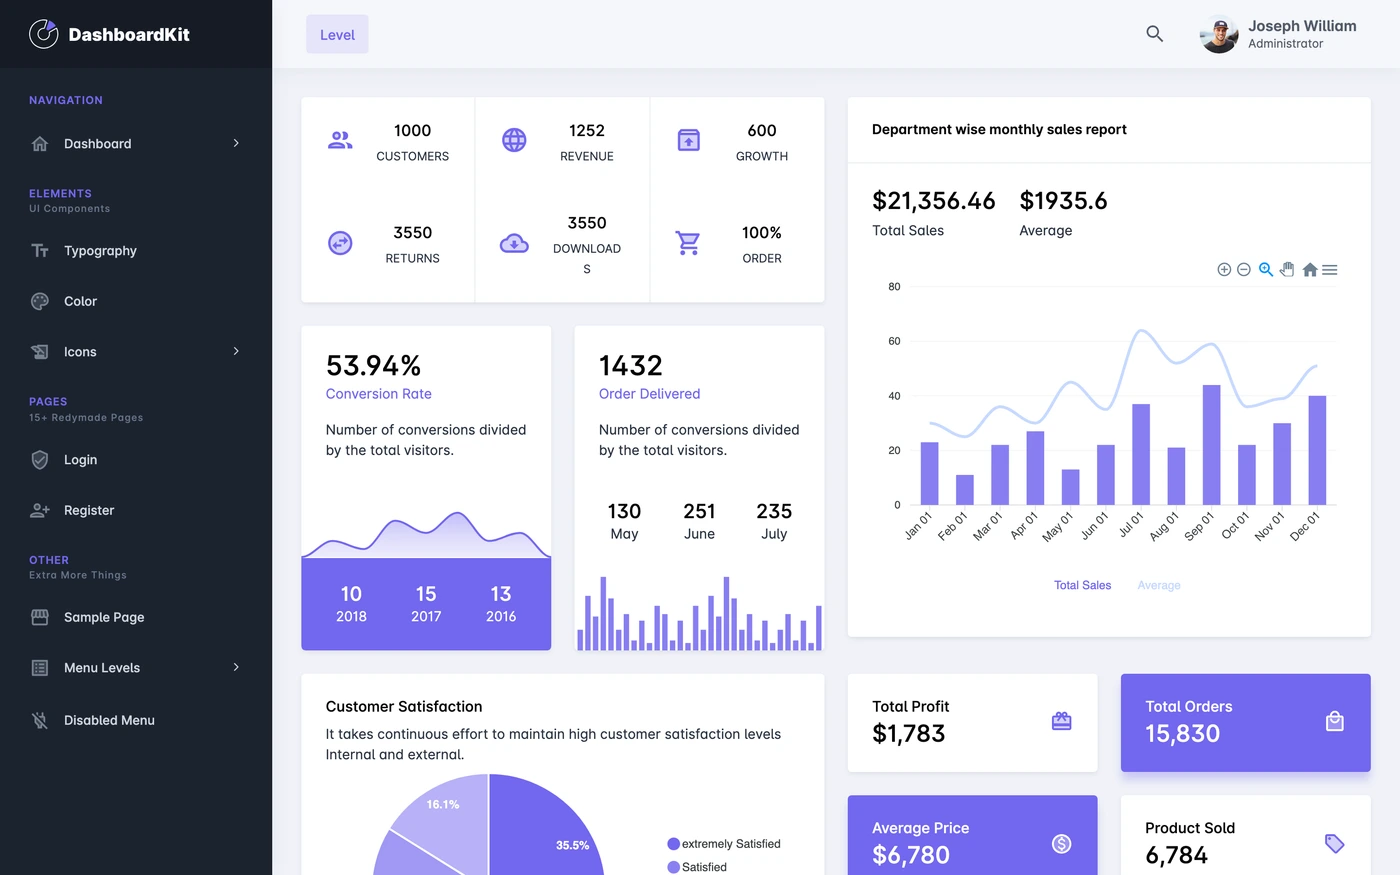
6 dashboard examples with design notes
These observations describe the captured screenshots below. They include public demo kits, not tests of their production APIs or interaction behavior. Open a collection for source context and additional captures.
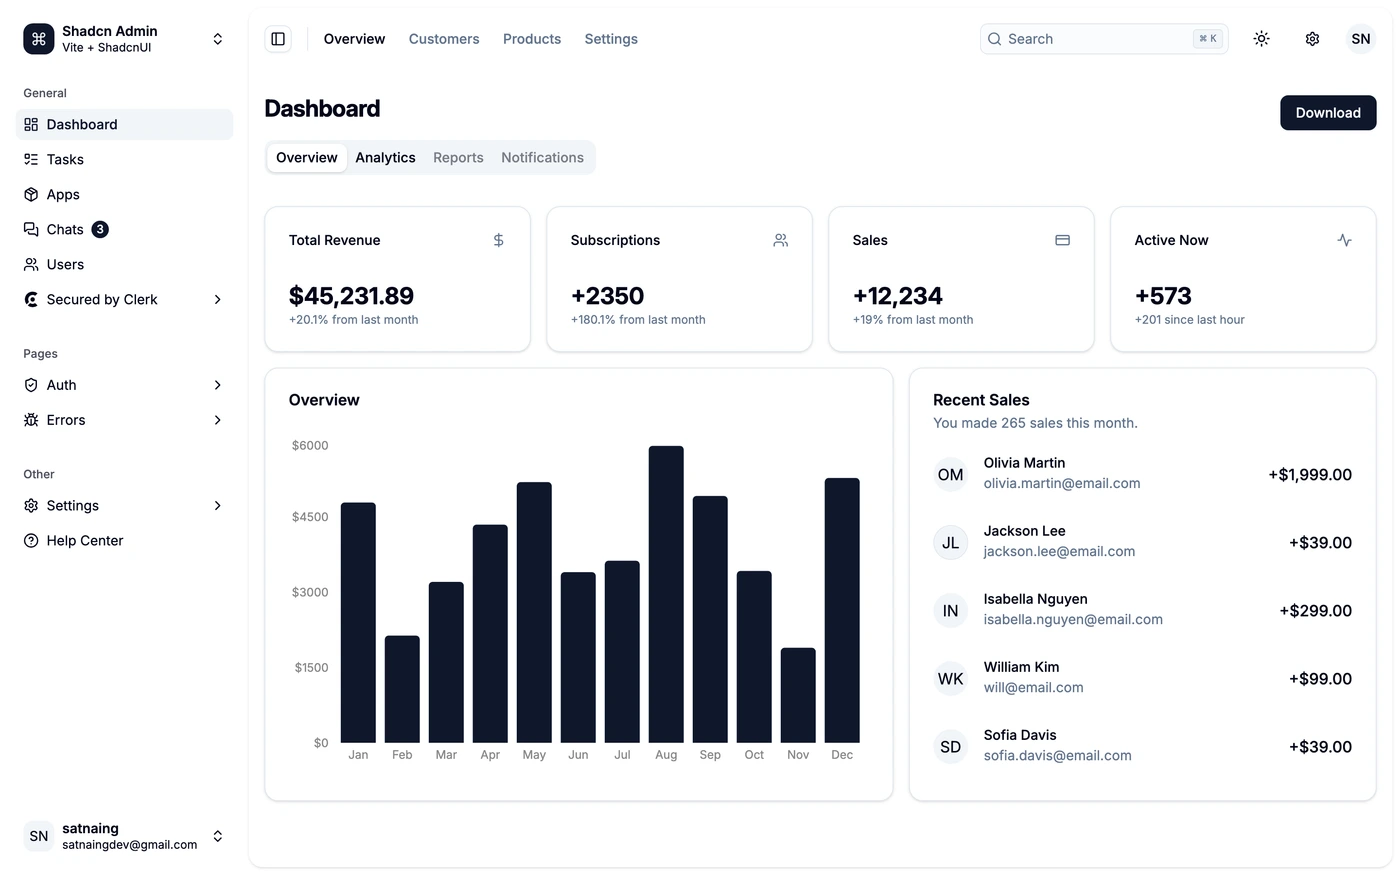
Shadcn Admin: Separate the overview from individual activity
- Observed in the capture
- Four neutral metric cards establish a compact summary. A large monthly bar chart sits beside the recent-sales list, while page tabs sit above both. The sidebar handles product areas separately from those local tabs.
- Adapt the pattern
- Pair a broad trend with the individual records that explain it. Keep page-level views separate from global navigation, and stack the chart and activity list when the screen narrows.
- Check before using it
- The customer rows and totals belong to a public demo. Replace them with your own data and test unusually long names, rather than treating the snapshot as evidence of a real business result.
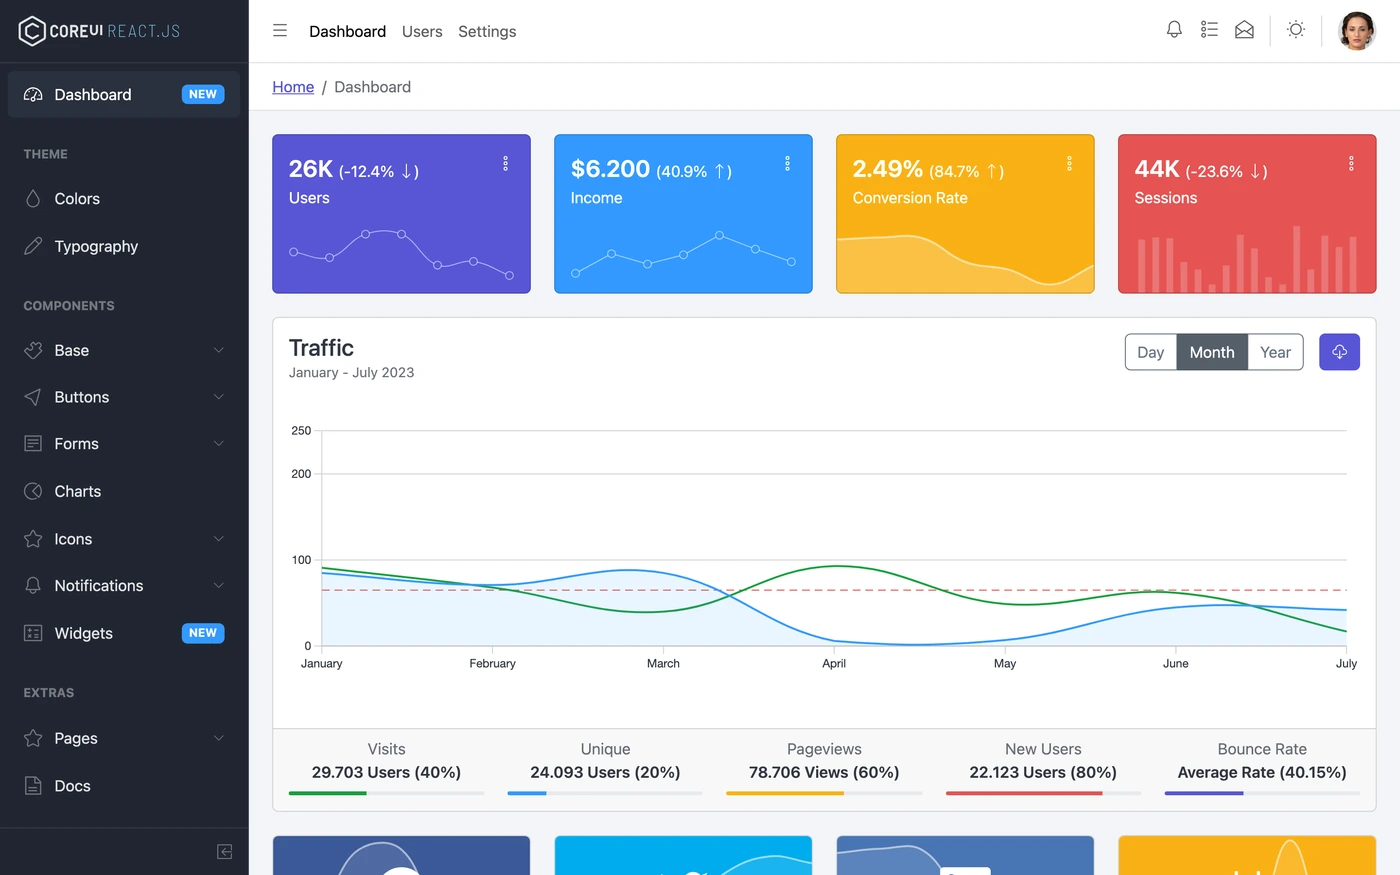
CoreUI: Give headline metrics and the main trend different jobs
- Observed in the capture
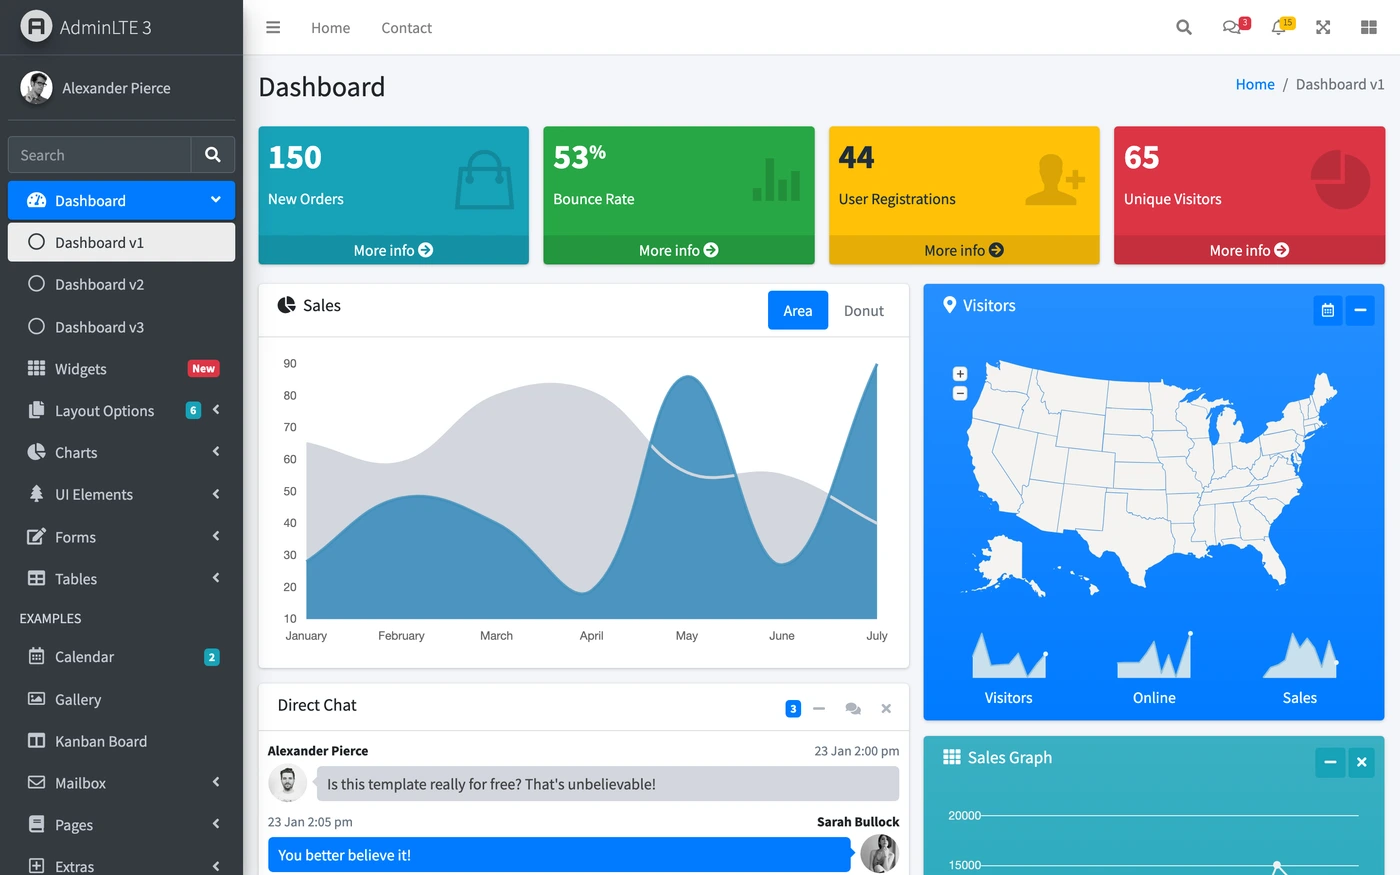
- Four colored metric cards lead into a wider traffic panel. The chart's period controls sit in its header, and a row of supporting traffic measures stays attached below the plot.
- Adapt the pattern
- Choose the few metrics that deserve immediate attention, then give the main trend more space. Keep period and unit labels close to the chart they describe.
- Check before using it
- Saturated cards compete for attention and require their own contrast checks. The snapshot shows the controls' placement, not proof that filtering, export or mobile states were tested.
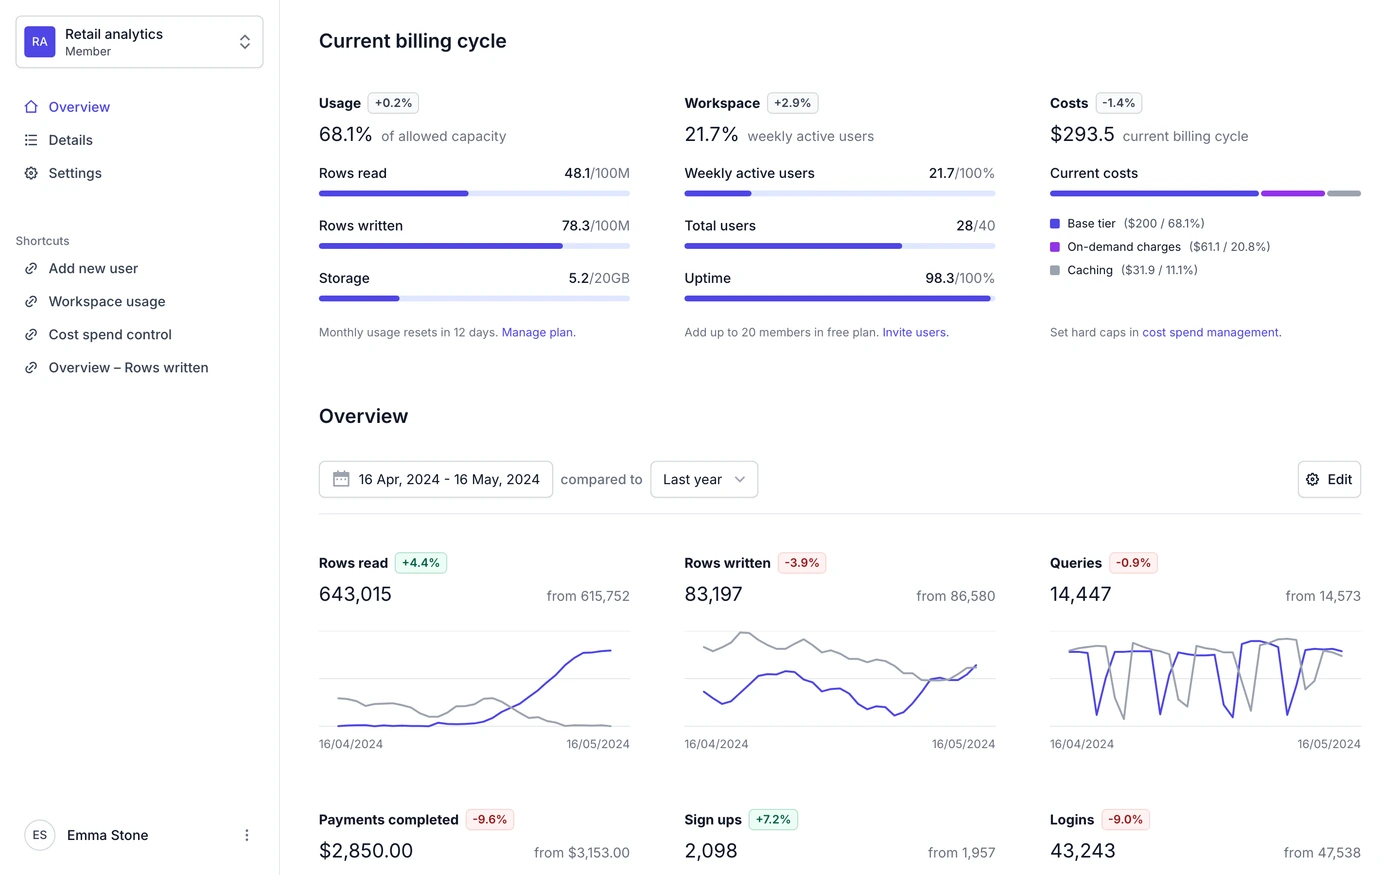
Tremor Dashboard: Explain usage with limits and comparison periods
- Observed in the capture
- Usage, workspace and costs are grouped into three columns. Capacity bars show both a used amount and a limit. Below them, the overview names a date range and comparison period before showing current and previous trend lines.
- Adapt the pattern
- Show denominators, reset periods and comparison dates alongside the number. A usage dashboard should explain what a percentage is measured against and what action follows it.
- Check before using it
- Small trend lines are useful for scanning but do not provide precise values by themselves. Add an accessible value view and test missing or delayed measurements in the implementation.
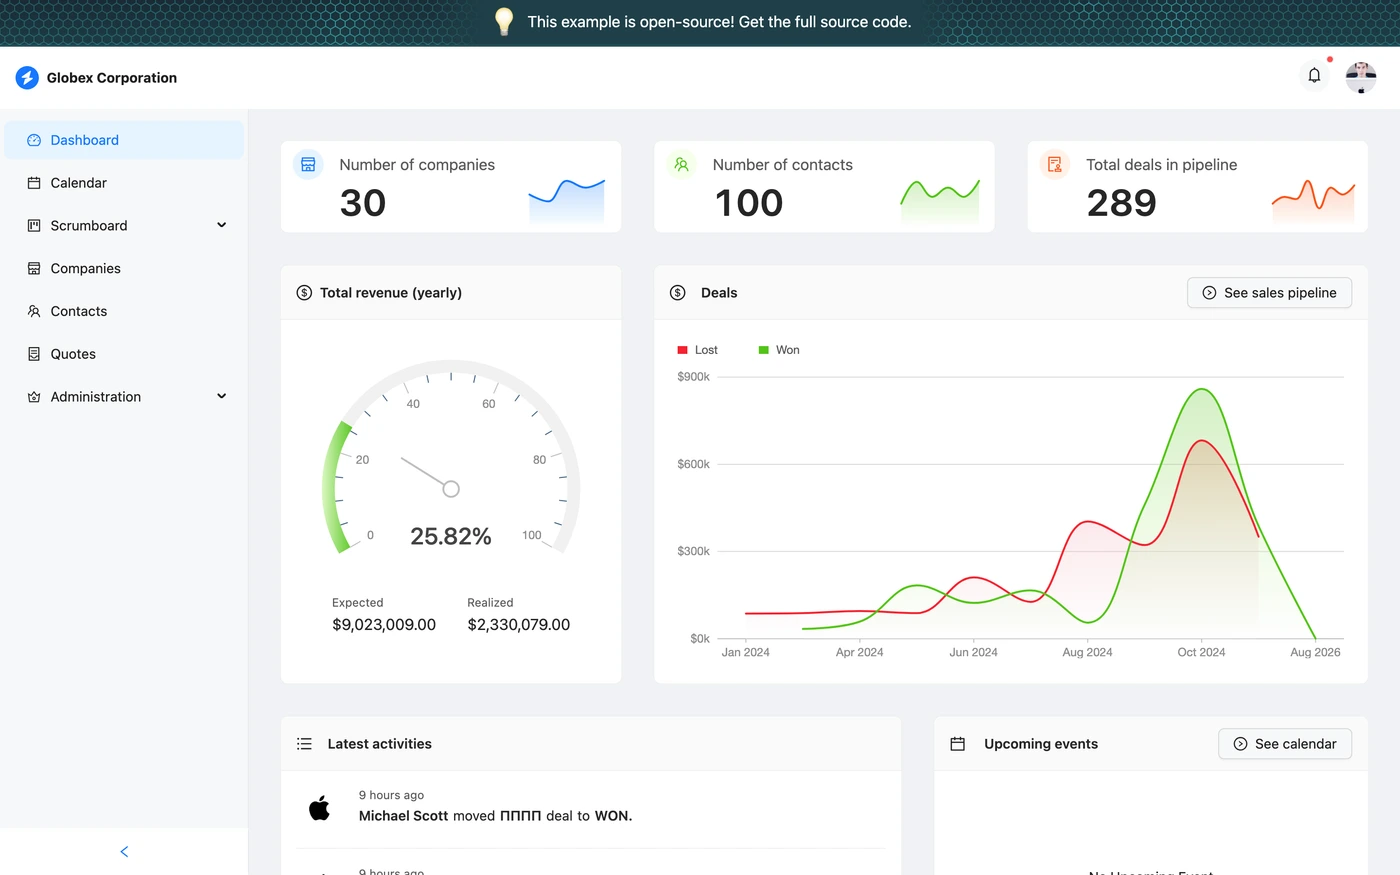
Refine CRM: Connect the overview to the next CRM task
- Observed in the capture
- Company, contact and deal counts sit above the financial views. The deals panel includes a visible sales-pipeline action, and the lower area begins an activity list and an upcoming-events panel.
- Adapt the pattern
- Use the overview to lead into a task such as reviewing the pipeline or opening a calendar. Keep those actions near the information that makes them useful.
- Check before using it
- A gauge needs a clearly defined target and unit. Verify those meanings with your real data; the captured sample does not establish what your own revenue calculation should be.
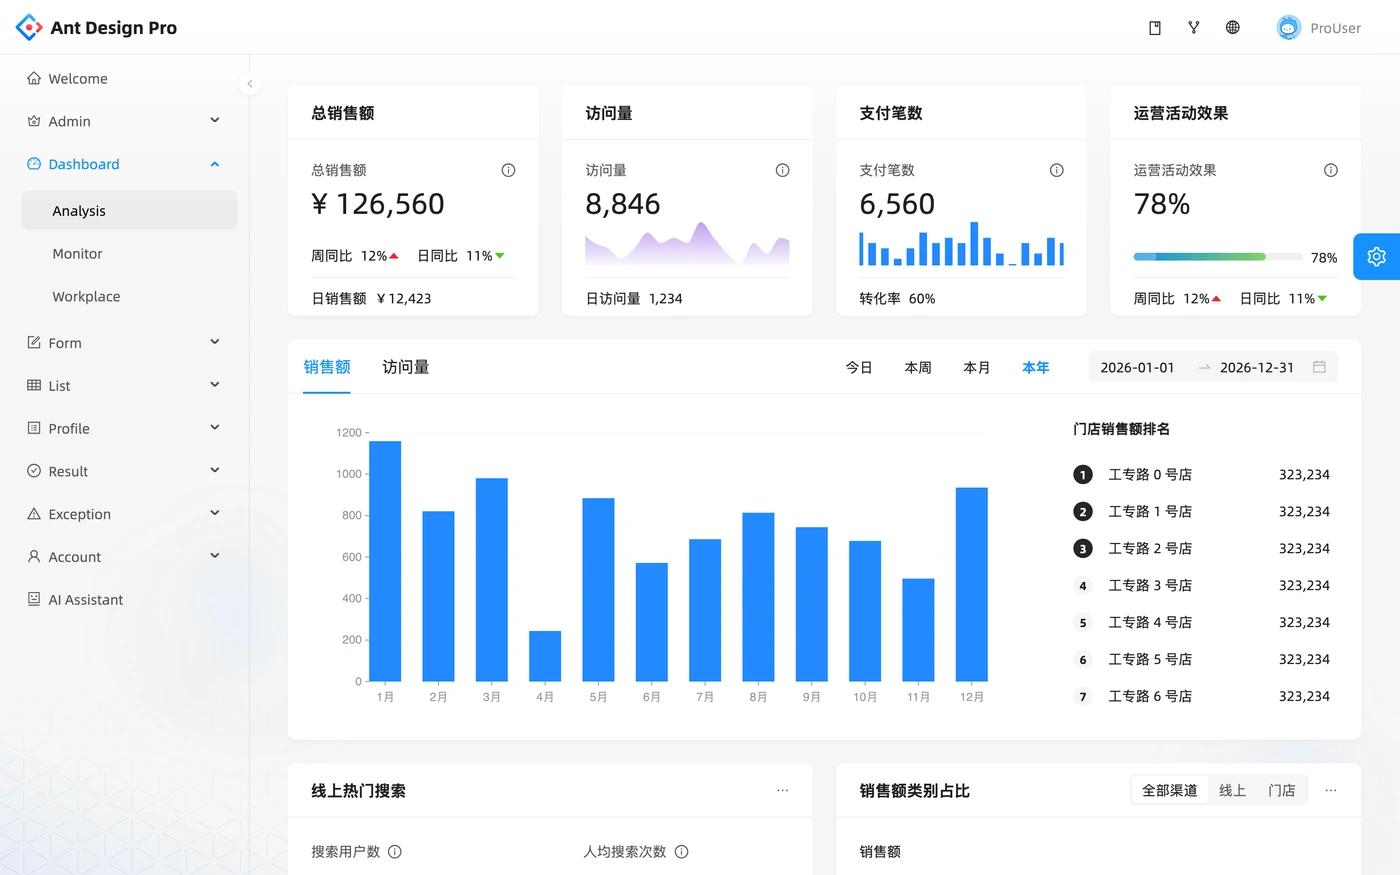
Ant Design Pro: Keep time controls beside the comparison view
- Observed in the capture
- Summary cards sit above a shared analysis area. Time controls are placed directly above the monthly bar chart, and a ranked list appears beside the plot within the same panel.
- Adapt the pattern
- Keep time context and the related comparison close together. Use a ranked list for ordering and a chart for shape, rather than expecting one view to communicate both perfectly.
- Check before using it
- The captured labels and formatting reflect one demo locale. Test translated labels, currency formatting and narrower layouts before carrying the pattern into your product.
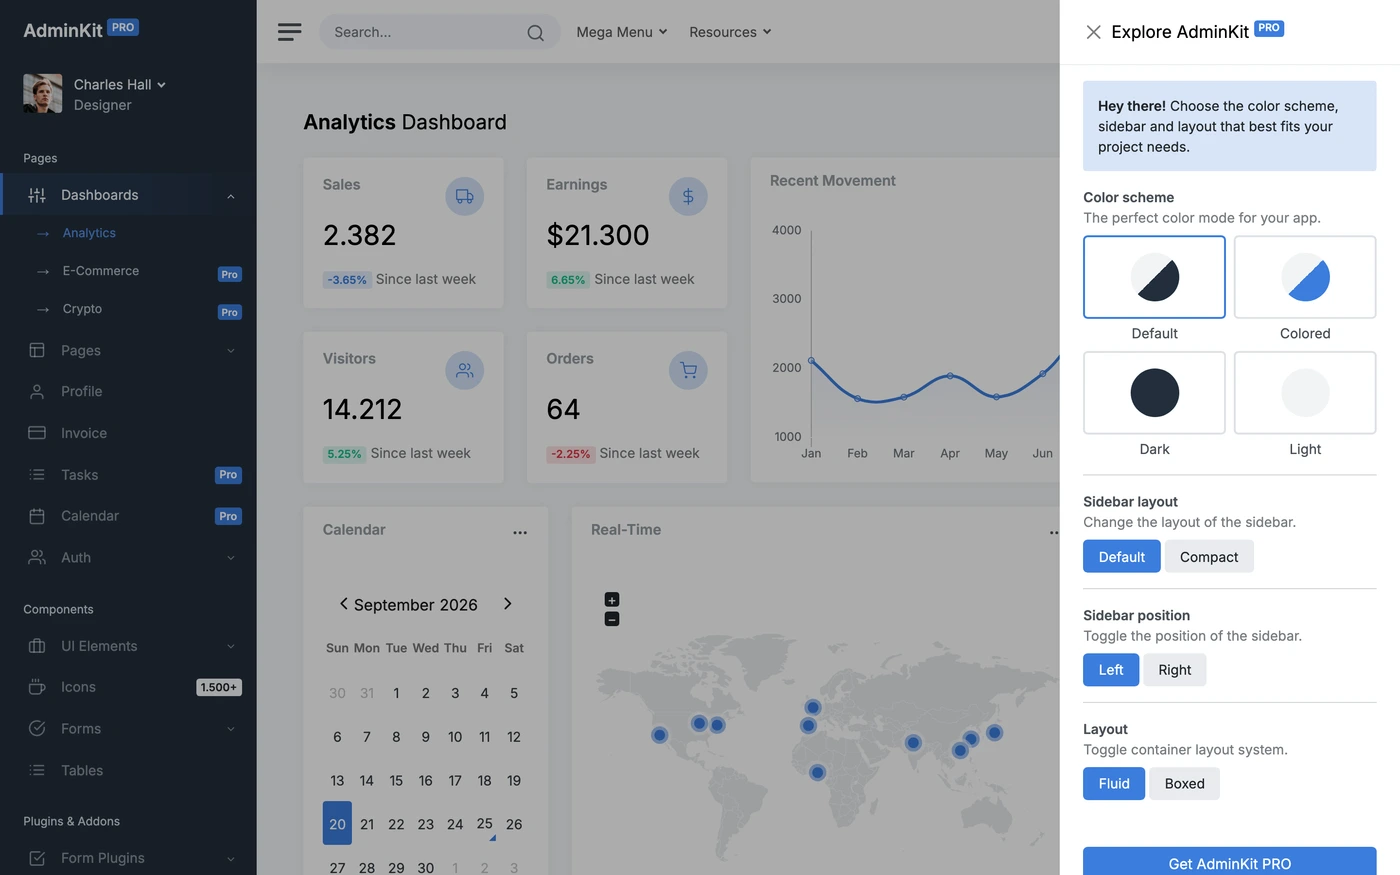
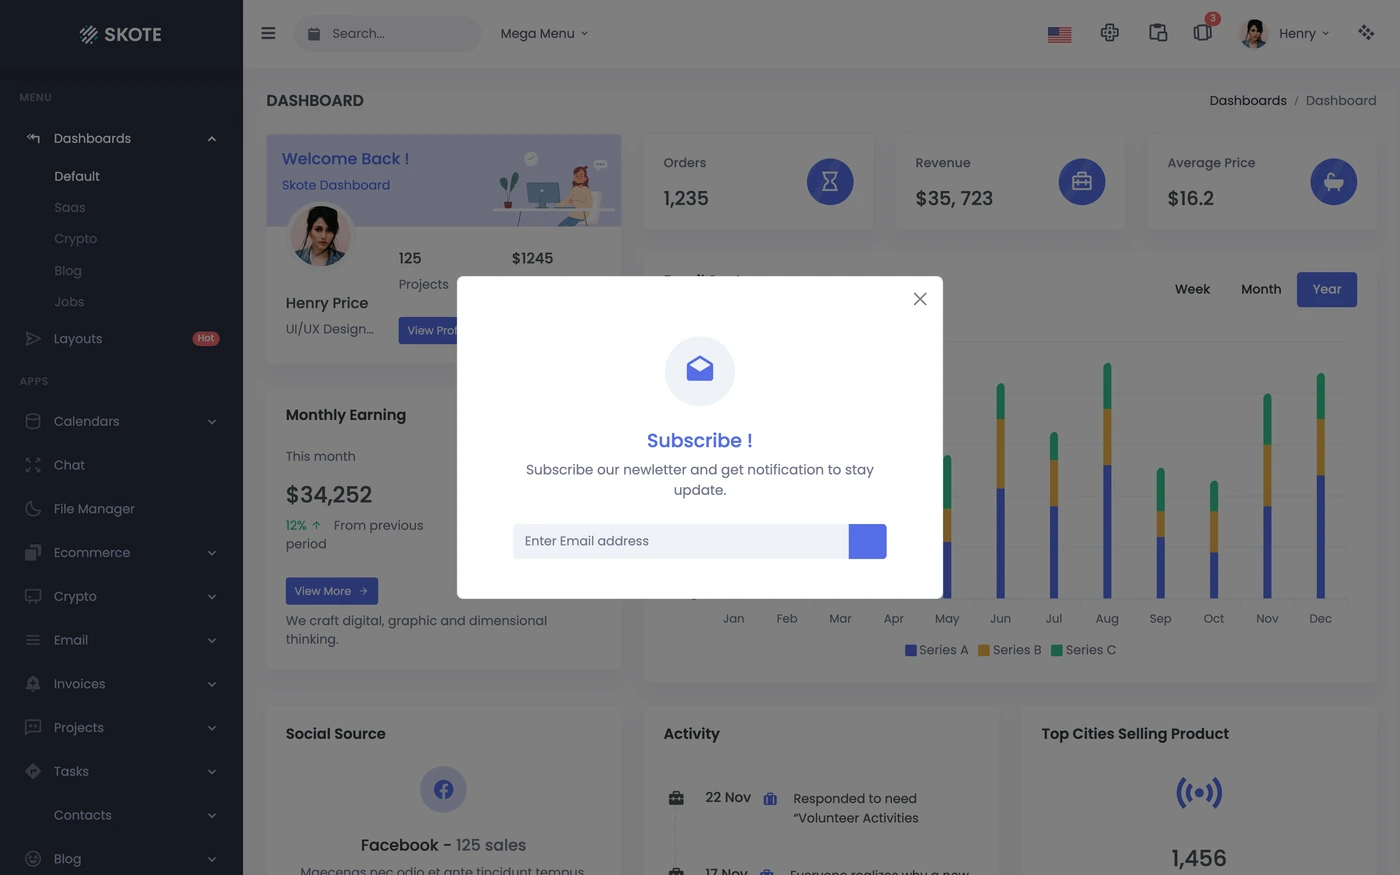
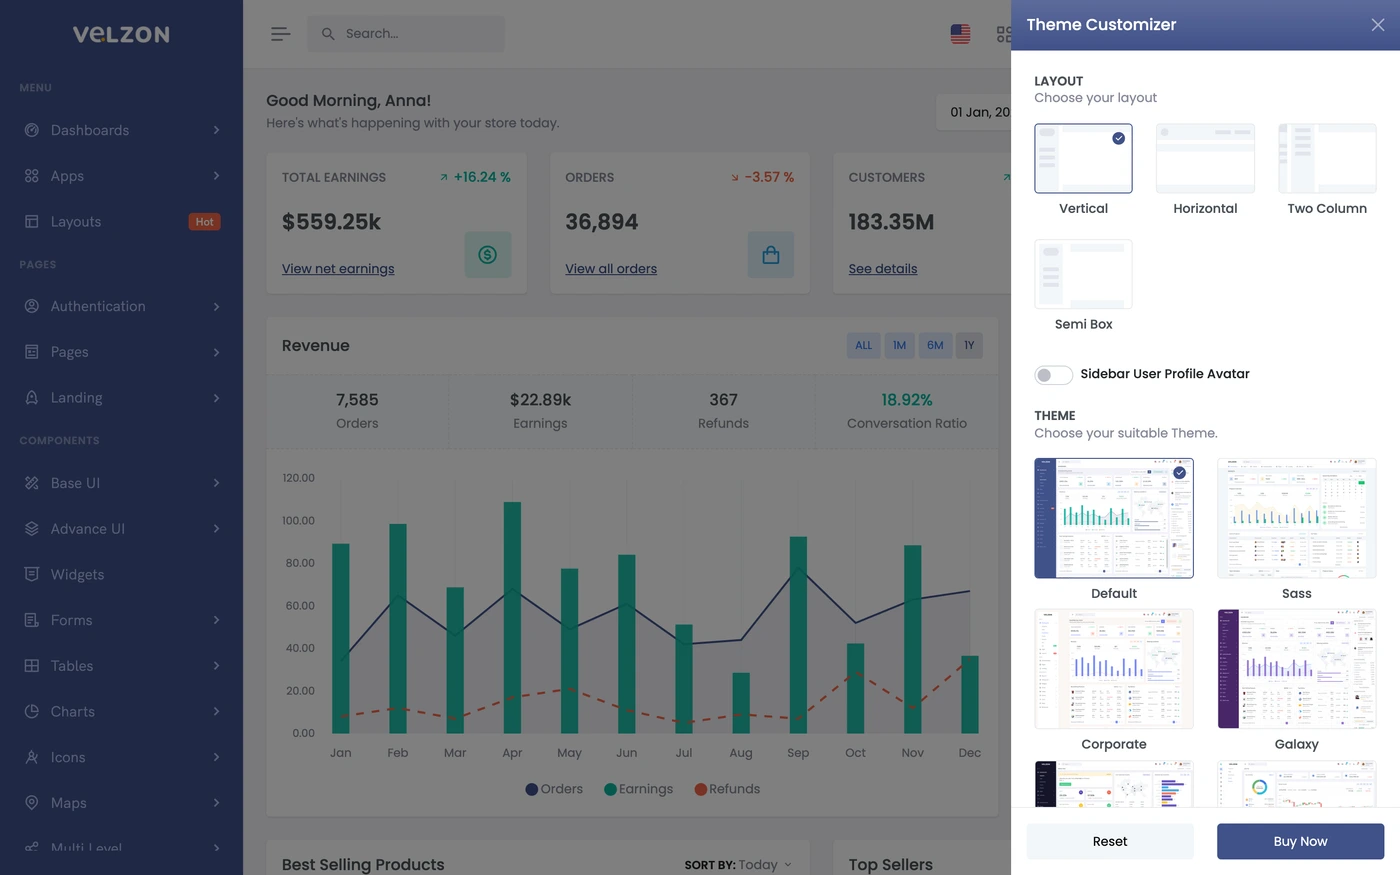
AdminKit: Separate display settings from the dashboard task
- Observed in the capture
- An open configuration drawer groups color scheme, sidebar layout, position and page-width options. The analytics dashboard is visibly dimmed behind the drawer.
- Adapt the pattern
- Group display settings away from the primary analytics task. When using a drawer, give it a clear close action and verify keyboard access and focus return.
- Check before using it
- This capture includes an overlay that covers part of the main chart. It is useful for studying the drawer, but use an unobscured view when inspecting the chart or metric layout.
A practical dashboard design checklist
Start with a decision and the data behind it
Choose the user and the question first. Name each metric’s unit, time range and data source. The SaaS dashboard guide helps separate product activity from billing and account information.
Keep summaries, comparisons and records in a clear order
Use summary cards to set context, charts to show a trend and tables or lists to support the next task. Keep chart controls nearby and inspect the analytics dashboard examples before choosing a visual encoding.
Test the states a screenshot cannot demonstrate
Try loading, no data, partial data, a failed request and a narrow viewport. The tested search-state example demonstrates empty results, retry and stale-response handling. Use the dashboard prompt brief to specify your own acceptance criteria.
Dashboard design questions
What should a dashboard design include?
Start with the decision the user needs to make. Show the relevant metric, its unit and time range, enough context to interpret it, and a clear next action. Navigation, filters and detail views should support that task instead of filling the page with unrelated cards.
How do I choose between a chart, a table and a metric card?
Use a metric card for a concise summary, a chart for change or comparison, and a table or list for individual records and actions. Show the time range and units with each view. For precise chart values, provide an accessible value view rather than relying only on the plotted shape.
What is the difference between an admin dashboard and an analytics dashboard?
An admin dashboard emphasizes operating a product: records, users, permissions and tasks. An analytics dashboard emphasizes understanding measurements and trends. A product can combine both, but the information hierarchy should make the user's immediate job clear.
Are these screenshots real production data?
They are actual captured interfaces, and the annotated selection includes public dashboard demo kits. The figures and customer rows in those demos illustrate their UI; they are not business results reported by UI Discovery. Capture dates and collection links provide the source context.
How can I adapt a dashboard reference with an AI prompt?
Describe the user, the decision, the required data and the states the interface must handle. Link the relevant captured reference and keep your existing design system and API contract. Test loading, empty results, rejected requests and narrow layouts before publishing the implementation.